In this lesson, we'll explore several key technical indicators, explaining how they're calculated, what they reveal about market conditions, and how traders typically apply them in practice.
Types of Technical Indicators
Technical indicators generally fall into four main categories:
- Trend Indicators: Help identify the direction and strength of trends (Moving Averages, MACD, ADX)
- Momentum Indicators: Measure the rate of price changes to identify overbought or oversold conditions (RSI, Stochastic Oscillator)
- Volatility Indicators: Gauge market volatility and potential price ranges (Bollinger Bands, Average True Range)
- Volume Indicators: Analyze trading volume to confirm price movements or identify divergences (On-Balance Volume, Volume Weighted Average Price)
Let's examine some of the most widely used indicators from each category.
Trend Indicators
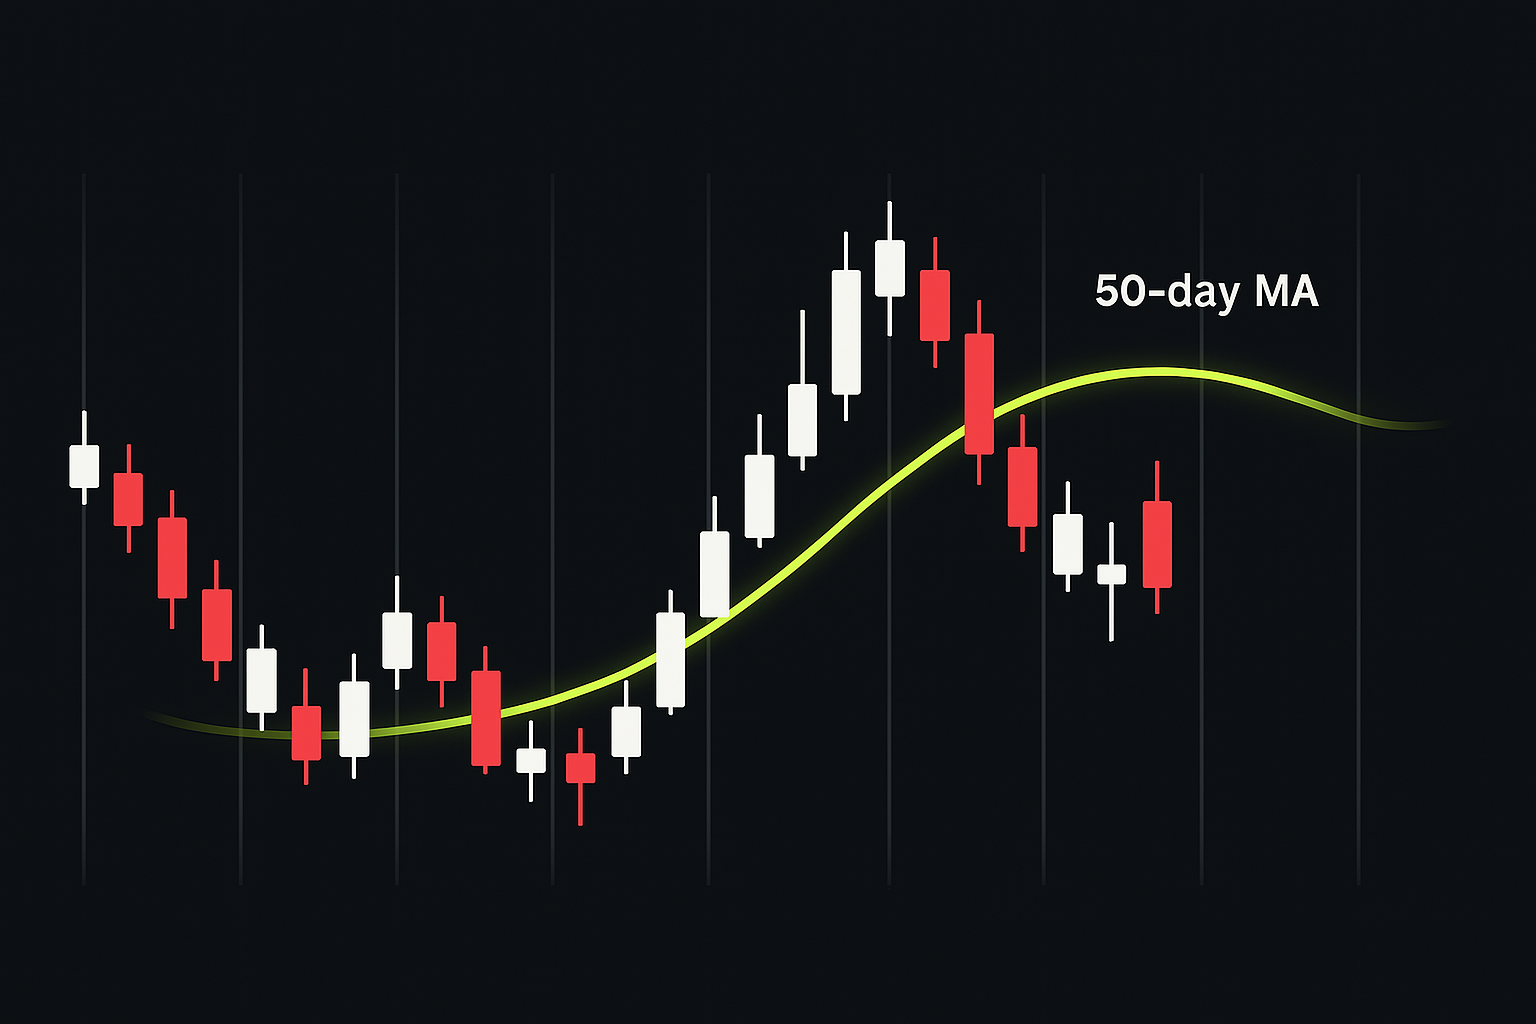
Moving Averages
Moving averages smooth out price action by calculating the average price over a specified period. They help identify trends while filtering out short-term noise.
- Simple Moving Average (SMA): Calculates the average price over a defined number of periods, giving equal weight to each period.
- Exponential Moving Average (EMA): Places greater weight on more recent prices, making it more responsive to new information.
Moving averages can be used to:
- Identify trend direction (price above MA = uptrend; price below MA = downtrend)
- Spot potential support and resistance levels
- Generate trading signals through crossovers
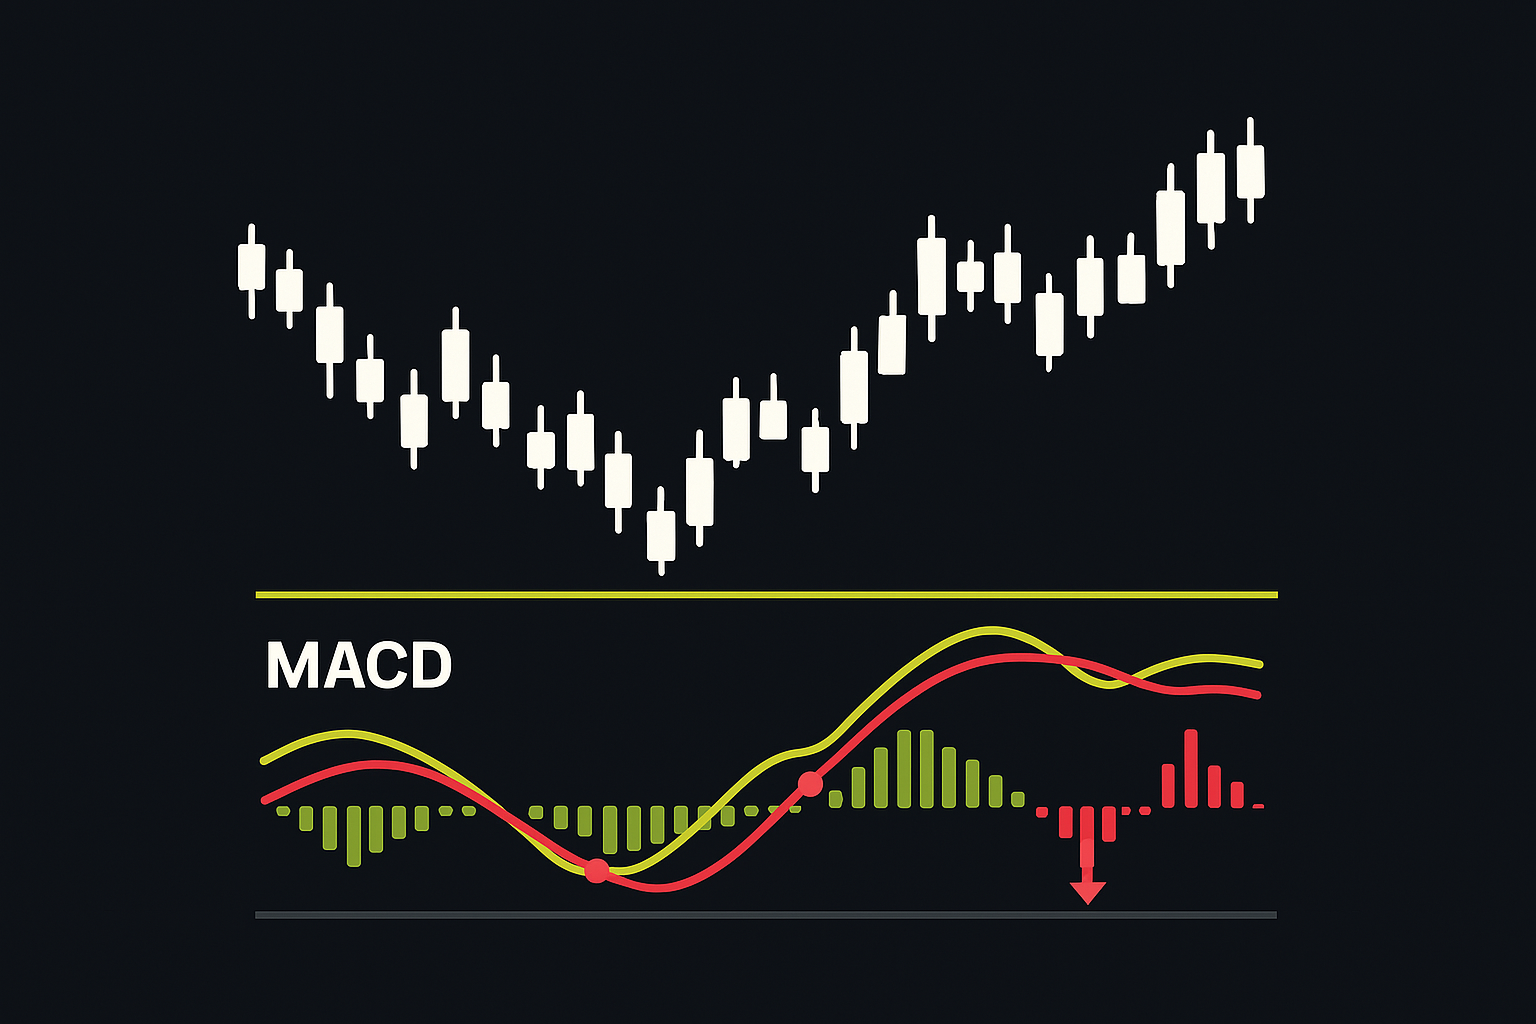
Moving Average Convergence Divergence (MACD)
The MACD transforms moving averages into an oscillator that measures momentum and trend direction. It consists of:
- The MACD line: Difference between 12-period and 26-period EMAs
- The Signal line: 9-period EMA of the MACD line
- The Histogram: Difference between MACD and Signal lines
Common trading signals include:
- MACD crossing above the Signal line (bullish)
- MACD crossing below the Signal line (bearish)
- Divergence between MACD and price (potential reversal)
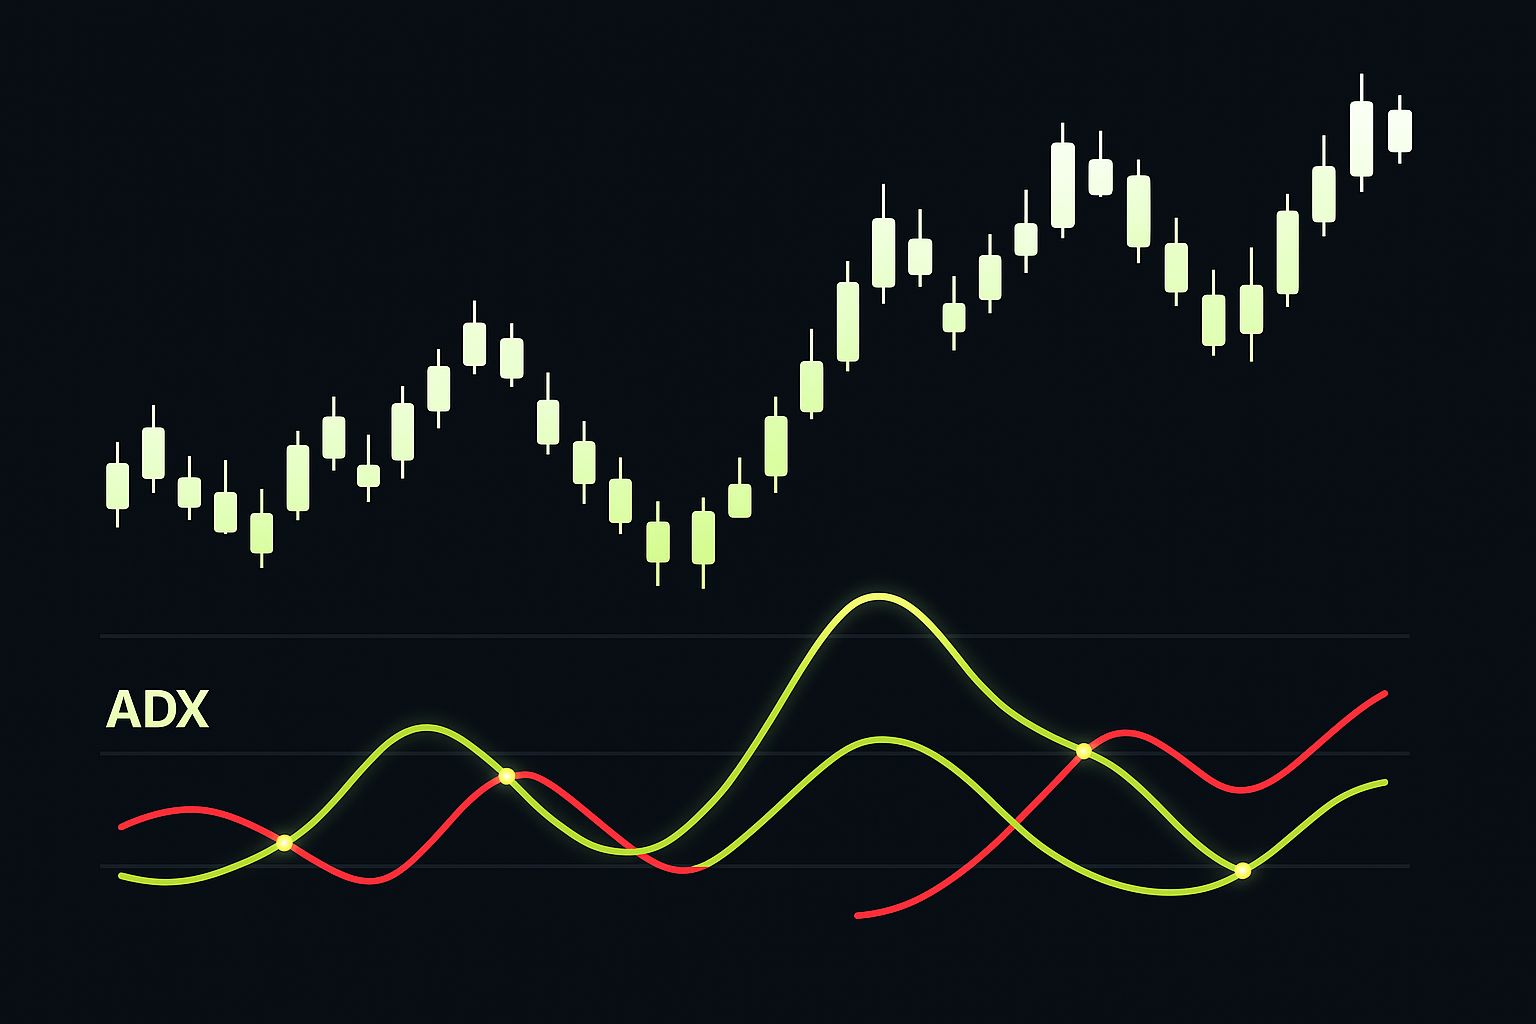
Average Directional Index (ADX)
Unlike most trend indicators, ADX doesn't show trend direction but instead measures trend strength on a scale from 0 to 100.
- Readings below 20 suggest a weak trend or ranging market
- Readings above 25 indicate a strengthening trend
- Readings above 50 signal a very strong trend
ADX helps traders determine whether trend-following strategies or range-bound approaches are more appropriate for current market conditions.
Momentum Indicators
Relative Strength Index (RSI)
The RSI measures the speed and magnitude of price movements on a scale from 0 to 100, helping identify overbought or oversold conditions.
- Readings above 70 typically indicate overbought conditions
- Readings below 30 typically indicate oversold conditions
- Divergence between RSI and price can signal potential reversals
Traditional interpretations suggest selling when RSI exceeds 70 and buying when it falls below 30. However, during strong trends, the RSI can remain in overbought or oversold territory for extended periods.
Stochastic Oscillator
The Stochastic Oscillator compares a security's closing price to its price range over a given time period. Like the RSI, it oscillates between 0 and 100 and helps identify overbought and oversold conditions.
The oscillator consists of two lines:
- %K: The main line showing the current close relative to the high-low range
- %D: A moving average of %K that acts as a signal line
Common interpretations include:
- Readings above 80 indicate overbought conditions
- Readings below 20 indicate oversold conditions
- %K crossing above %D signals potential buying opportunity
- %K crossing below %D signals potential selling opportunity
Volatility Indicators
Bollinger Bands
Bollinger Bands consist of three lines:
- Middle Band: A 20-period simple moving average
- Upper Band: Middle band plus two standard deviations
- Lower Band: Middle band minus two standard deviations
These bands expand during periods of high volatility and contract during low volatility, creating a dynamic channel that contains approximately 95% of price action.
Traders use Bollinger Bands to:
- Identify potential support (lower band) and resistance (upper band)
- Recognize periods of low volatility that might precede breakouts
- Spot potential mean-reversion opportunities
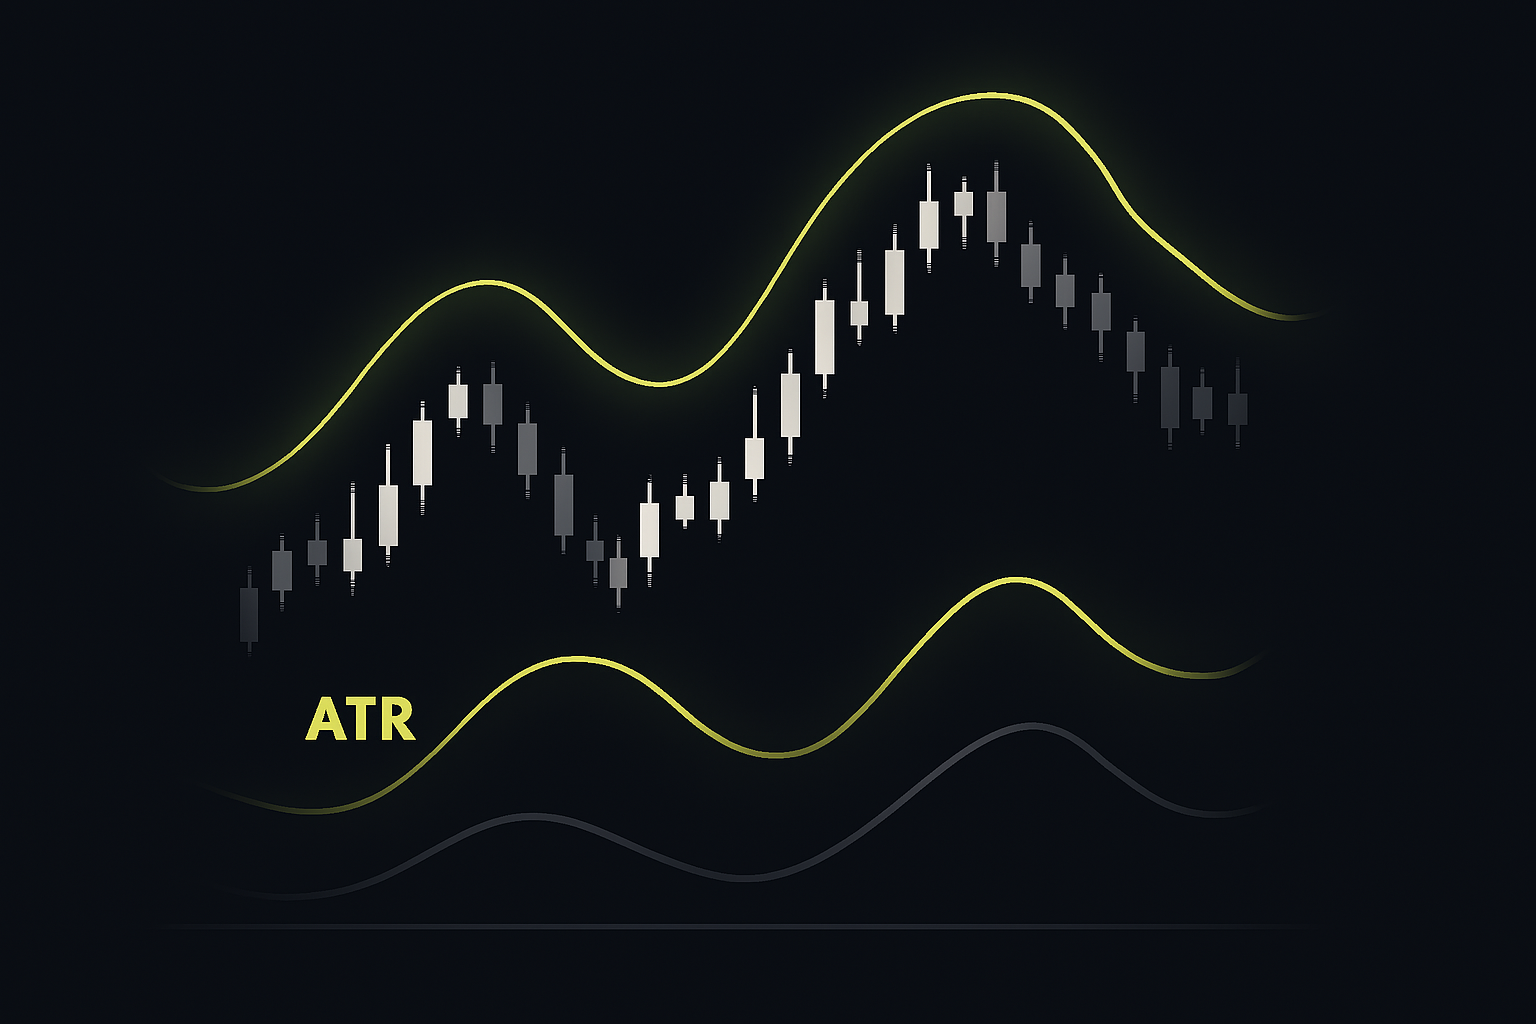
Average True Range (ATR)
The Average True Range measures market volatility by calculating the average range of price movement over a specified period (typically 14 days). Unlike most indicators, ATR is not directional; it simply quantifies volatility.
Traders use ATR to:
- Set appropriate stop-loss levels based on market volatility
- Determine position sizing
- Identify potential breakout opportunities following low-volatility periods
Volume Indicators
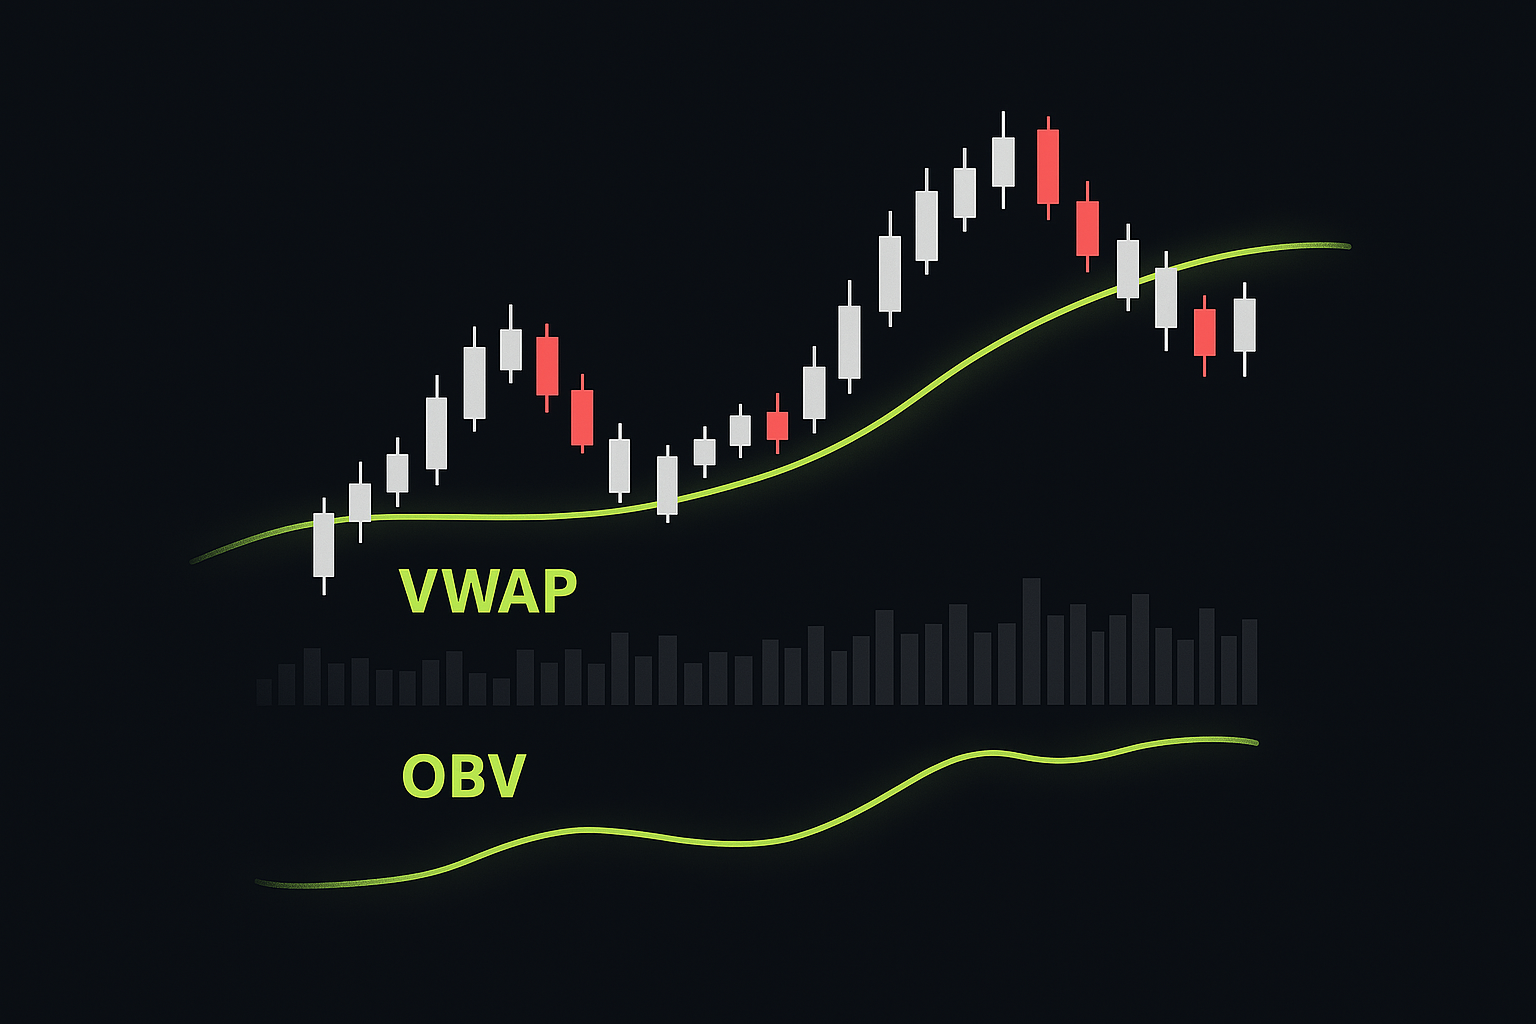
On-Balance Volume (OBV)
On-Balance Volume accumulates volume, adding volume on up days and subtracting it on down days. This creates a running total that helps identify whether volume is flowing into or out of a security.
Traders use OBV to:
- Confirm price trends (OBV should move in the same direction as price)
- Identify potential reversals through OBV divergence
- Spot accumulation or distribution phases
For example, if a stock's price is making new highs but OBV is failing to reach new highs (bearish divergence), this suggests weakening buying pressure despite the price strength and could indicate a potential reversal.
Volume Weighted Average Price (VWAP)
The Volume Weighted Average Price calculates the average price weighted by volume throughout the trading day. VWAP is especially popular among institutional traders and day traders.
VWAP serves as:
- A dynamic support/resistance level
- A benchmark for execution quality
- A reference point for intraday trading decisions
Many day traders follow the simple rule: buy when price is above VWAP and sell when it's below. For example, a day trader might wait for a stock to pull back to VWAP during an uptrend before entering a long position, using VWAP as a reference point for placing a stop-loss.
Key Takeaways
- Technical indicators transform price and volume data into visual representations that highlight specific market characteristics
- Trend indicators help identify the direction and strength of market trends
- Momentum indicators identify overbought/oversold conditions and potential reversals
- Volatility indicators measure market volatility and help set appropriate stop levels
- Volume indicators confirm price movements and can provide early warning of potential reversals
- No single indicator works in all market conditions; adapt your approach to current market environments
Next Steps
In our next lesson, we'll explore divergence trading – an advanced technique that identifies discrepancies between price action and technical indicators to anticipate potential market reversals. Understanding divergence adds another powerful tool to your technical analysis toolkit and helps identify high-probability trading opportunities.