Understanding chart patterns provides traders with a framework to anticipate future price movements, identify potential entry and exit points, and set appropriate stop-loss levels. In this lesson, we'll explore the most common and reliable chart patterns and how to trade them effectively.
Reversal Patterns
Reversal patterns signal that the current trend may be ending and a new trend in the opposite direction could be beginning. These patterns are particularly valuable as they can identify major turning points in the market.
Head and Shoulders
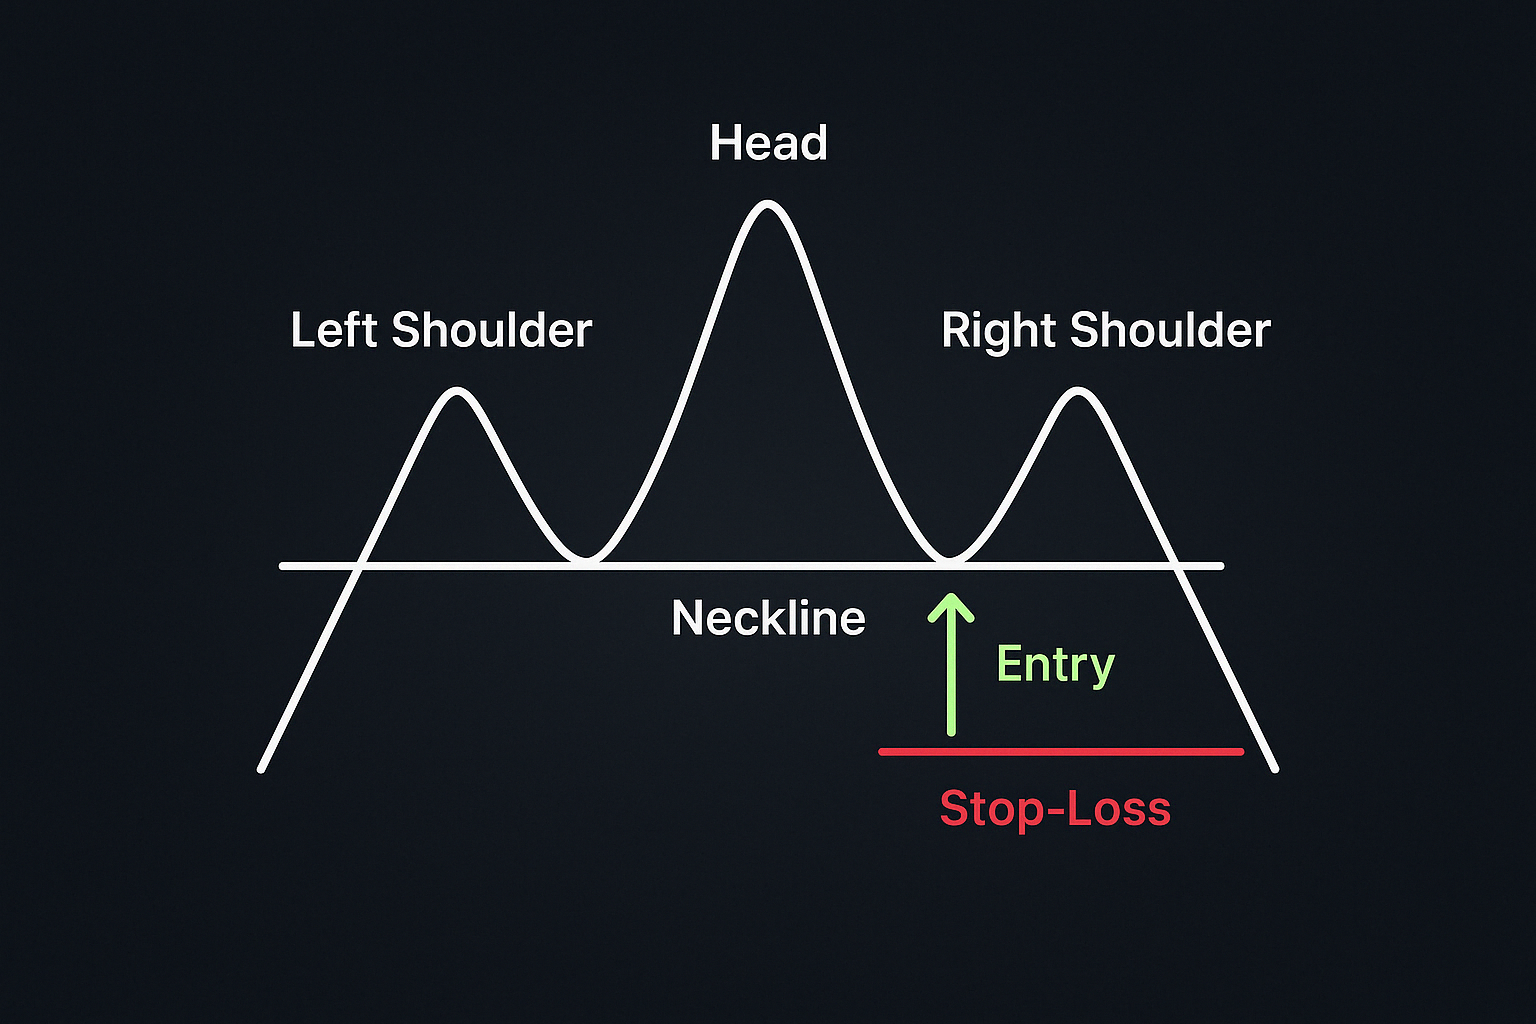
The Head and Shoulders pattern is considered one of the most reliable reversal patterns. It forms after an extended uptrend and signals a potential trend reversal from bullish to bearish.
The pattern consists of:
- Left shoulder: An initial peak followed by a minor pullback
- Head: A higher peak followed by another pullback
- Right shoulder: A third peak, lower than the head and approximately the same height as the left shoulder
- Neckline: The support line connecting the lows between the shoulders and head
When price breaks below the neckline after forming the right shoulder, it signals a potential trend reversal. Traders often enter short positions on the neckline break, with stop-loss orders placed above the right shoulder.
For example, a stock that's been rising for months might form a head and shoulders pattern as buying momentum fades. After breaking the neckline, the price often falls by at least the distance from the head to the neckline.
Inverse Head and Shoulders
The Inverse Head and Shoulders is the opposite of the standard pattern and signals a potential reversal from a bearish to a bullish trend. It forms after an extended downtrend.
When price breaks above the neckline after forming the right shoulder, it signals a potential bullish reversal. Traders often enter long positions on the neckline break, with stop-loss orders placed below the right shoulder.
Double Top
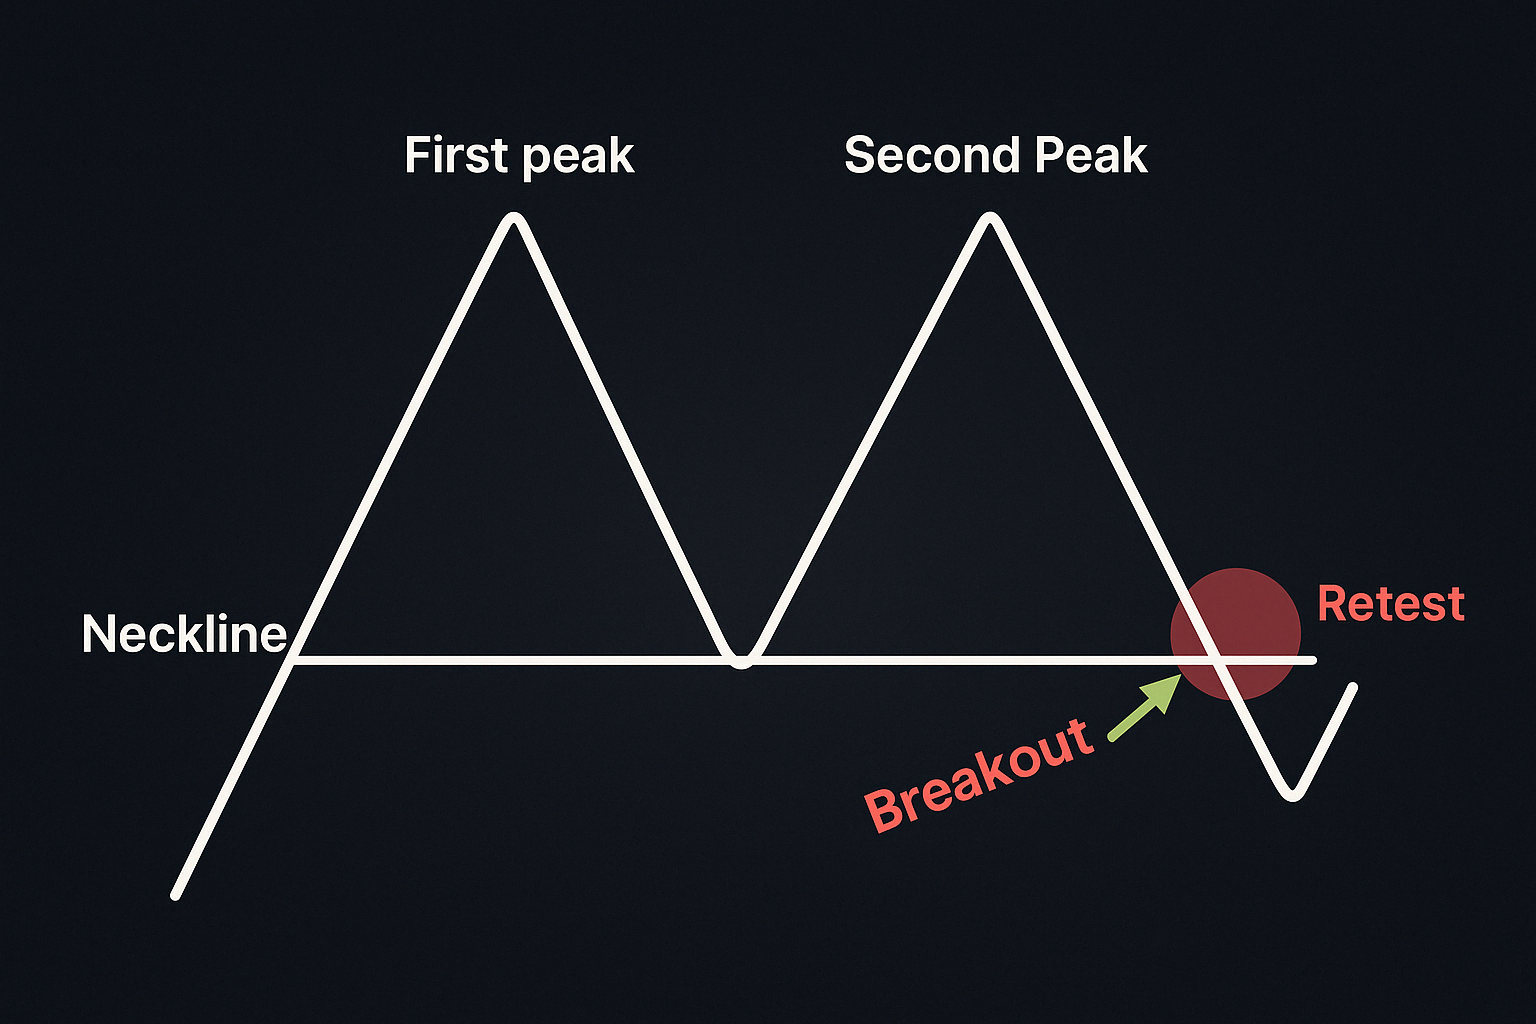
The Double Top is a bearish reversal pattern that forms after an uptrend. It consists of two peaks at approximately the same price level, with a moderate trough between them.
The pattern is confirmed when price breaks below the support level (neckline) formed by the trough between the two peaks. This breakdown signals that buyers have failed twice to push the price beyond a certain level, and sellers have taken control.
Traders can enter short positions either on the neckline break or on a retest of the neckline from below, with stop-losses placed above the right peak.
Double Bottom
The Double Bottom is a bullish reversal pattern that forms after a downtrend. It consists of two troughs at approximately the same price level, with a moderate peak between them.
Traders can enter long positions either on the neckline break or on a retest of the neckline from above, with stop-losses placed below the right trough.
Cup and Handle
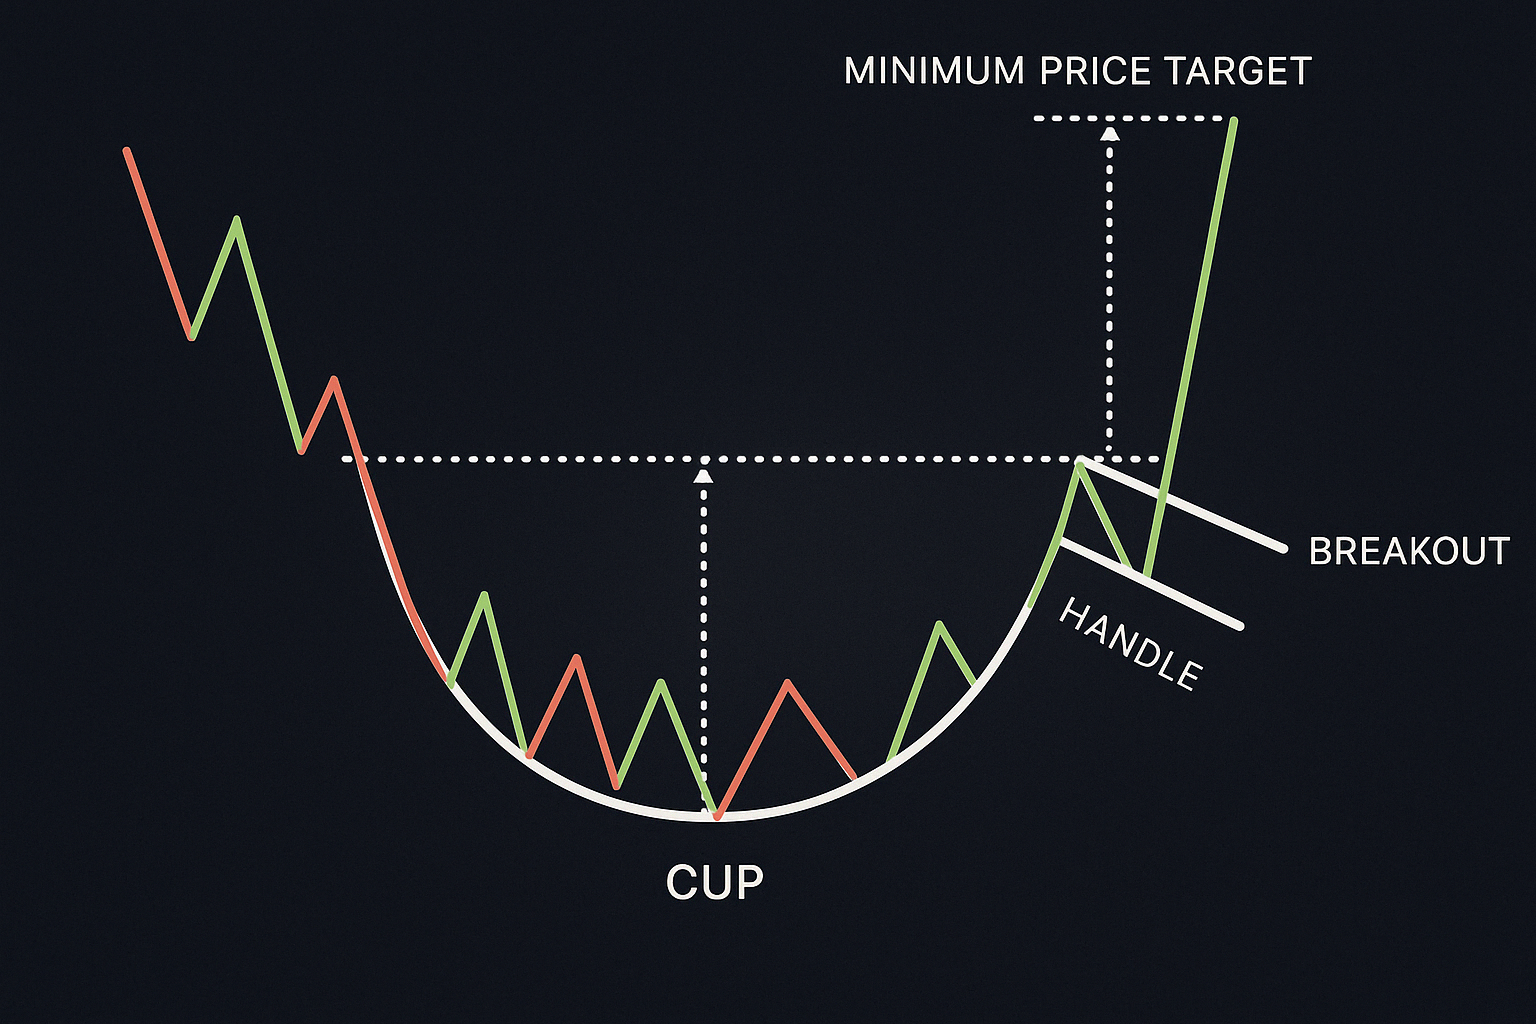
The Cup and Handle is a bullish continuation pattern that forms during an uptrend and signals a brief consolidation before the uptrend continues.
The pattern consists of:
- Cup: A rounded bottom formation resembling a U shape
- Handle: A slight downward drift forming a small channel or flag on the right side of the cup
The pattern completes when price breaks above the resistance level formed by the highs on either side of the cup. This breakout signals the resumption of the uptrend.
As the name suggests, this pattern visually resembles a cup with a handle when viewed on a chart. It typically forms over longer periods, making it more reliable on daily and weekly charts than on short-term timeframes.
Traders often enter long positions on the break above resistance or on a retest of that level, placing stop-losses below the low of the handle.
Continuation Patterns
Continuation patterns signal a temporary pause in the current trend before it resumes in the same direction. These patterns help traders identify opportunities to join existing trends during consolidation phases.
Ascending Triangle
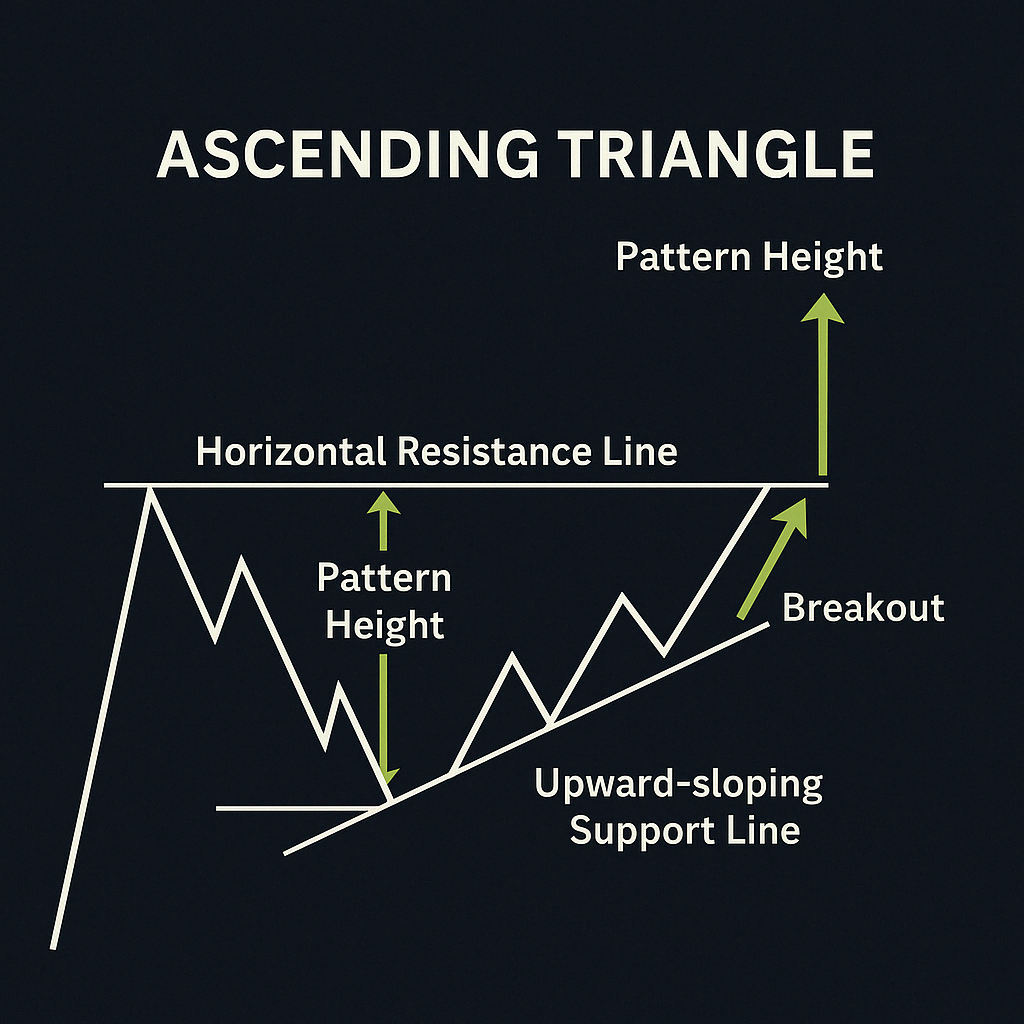
The Ascending Triangle is a bullish continuation pattern that typically forms during an uptrend. It consists of:
- A horizontal resistance line connecting at least two highs
- An upward-sloping support line connecting a series of higher lows
This pattern indicates that while sellers are defending a specific price level (the horizontal resistance), buyers are becoming increasingly aggressive, stepping in at progressively higher prices (the upward-sloping support).
When price eventually breaks above the horizontal resistance, it signals the continuation of the uptrend. The pattern shows that selling pressure at the resistance level has been absorbed, allowing buyers to push the price higher.
Traders typically enter long positions on the breakout above resistance, with stop-losses placed below the most recent higher low.
Descending Triangle
The Descending Triangle is a bearish continuation pattern that typically forms during a downtrend. It consists of:
- A horizontal support line connecting at least two lows
- A downward-sloping resistance line connecting a series of lower highs
This pattern indicates that while buyers are defending a specific price level (the horizontal support), sellers are becoming increasingly aggressive, stepping in at progressively lower prices (the downward-sloping resistance).
When price eventually breaks below the horizontal support, it signals the continuation of the downtrend. The pattern shows that buying pressure at the support level has been exhausted, allowing sellers to push the price lower.
Traders typically enter short positions on the breakdown below support, with stop-losses placed above the most recent lower high.
Flags and Pennants
Flags and pennants are short-term continuation patterns that form after a strong price move (the "flagpole"). They represent brief consolidation periods before the trend continues.
Bull Flag: Forms during an uptrend and consists of a downward-sloping channel against the prevailing uptrend. The flag forms as the market takes a brief pause after a sharp rally. Once price breaks above the upper boundary of the flag, the uptrend typically resumes.
Bear Flag: Forms during a downtrend and consists of an upward-sloping channel against the prevailing downtrend. The flag forms as the market takes a brief pause after a sharp decline. Once price breaks below the lower boundary of the flag, the downtrend typically resumes.
Flags usually form over shorter periods (a few days to a couple of weeks) and represent a counter-trend consolidation. The breakout from the flag often leads to a move of similar magnitude to the flagpole that preceded it.
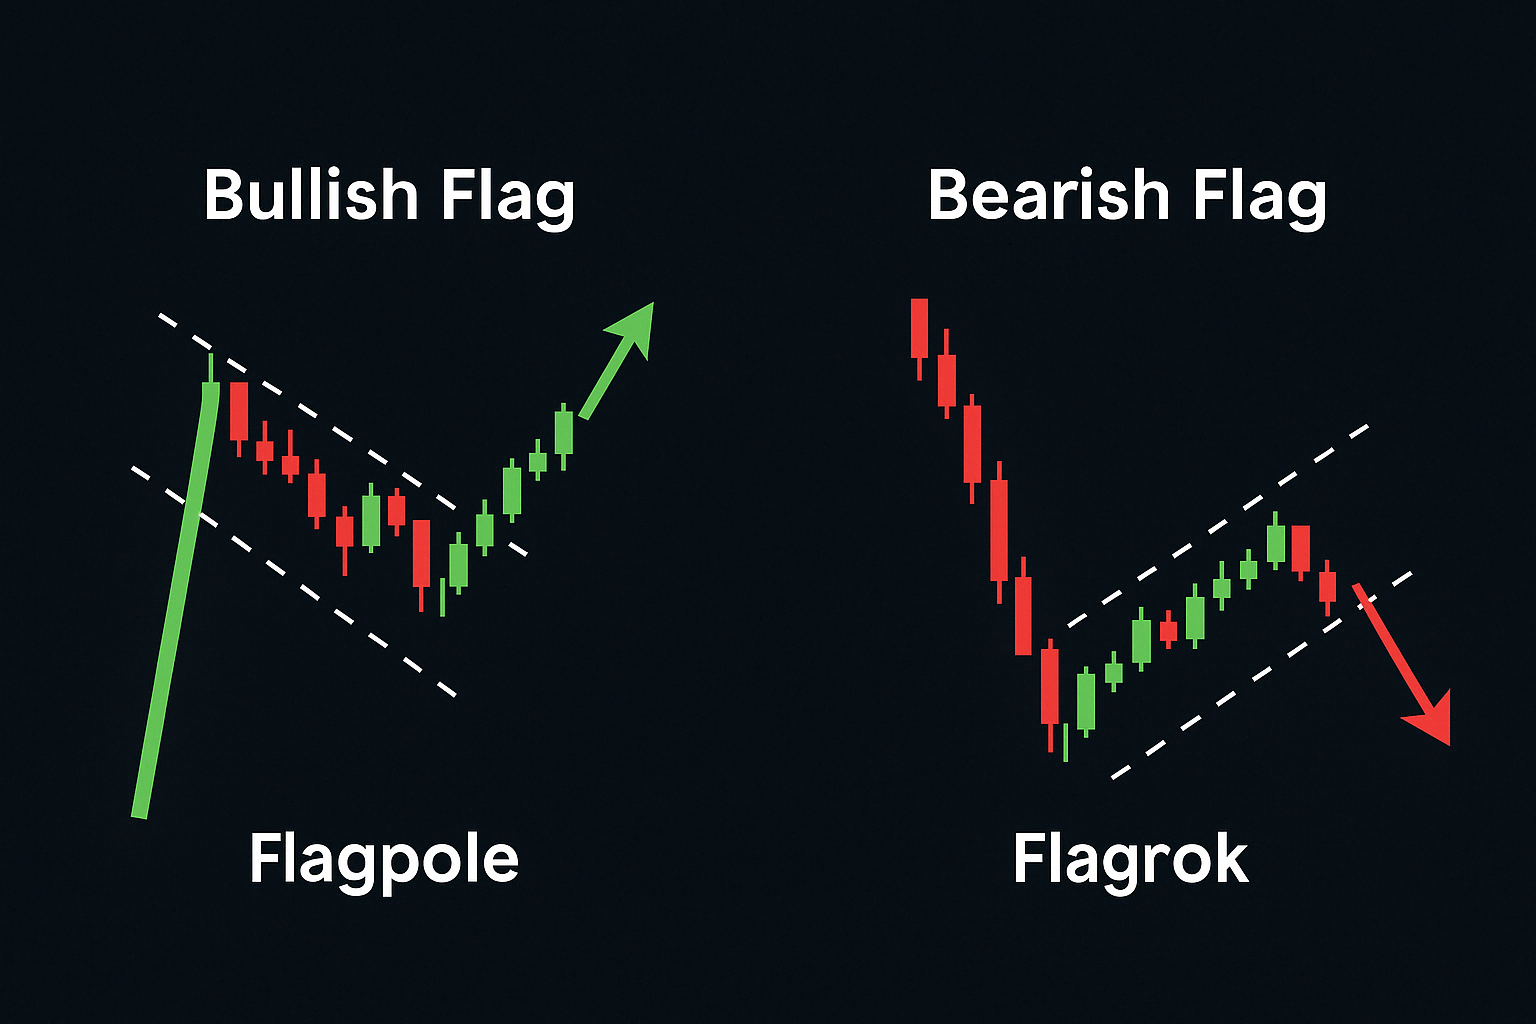
Traders enter in the direction of the prevailing trend when price breaks out of the flag formation, with stop-losses placed on the opposite side of the flag.
Wedge Patterns
Wedge patterns can signal either continuation or reversal, depending on the context and how they form relative to the prevailing trend.
Falling Wedge
A Falling Wedge is characterized by lower highs and lower lows with converging trendlines, where the lower trendline has a steeper slope than the upper trendline. This pattern can be either:
- A bullish reversal pattern when it forms during a downtrend
- A bullish continuation pattern when it forms during an uptrend
The pattern is confirmed when price breaks above the upper trendline, signaling a potential upward move. This breakout indicates that selling pressure is diminishing, and buyers are taking control.
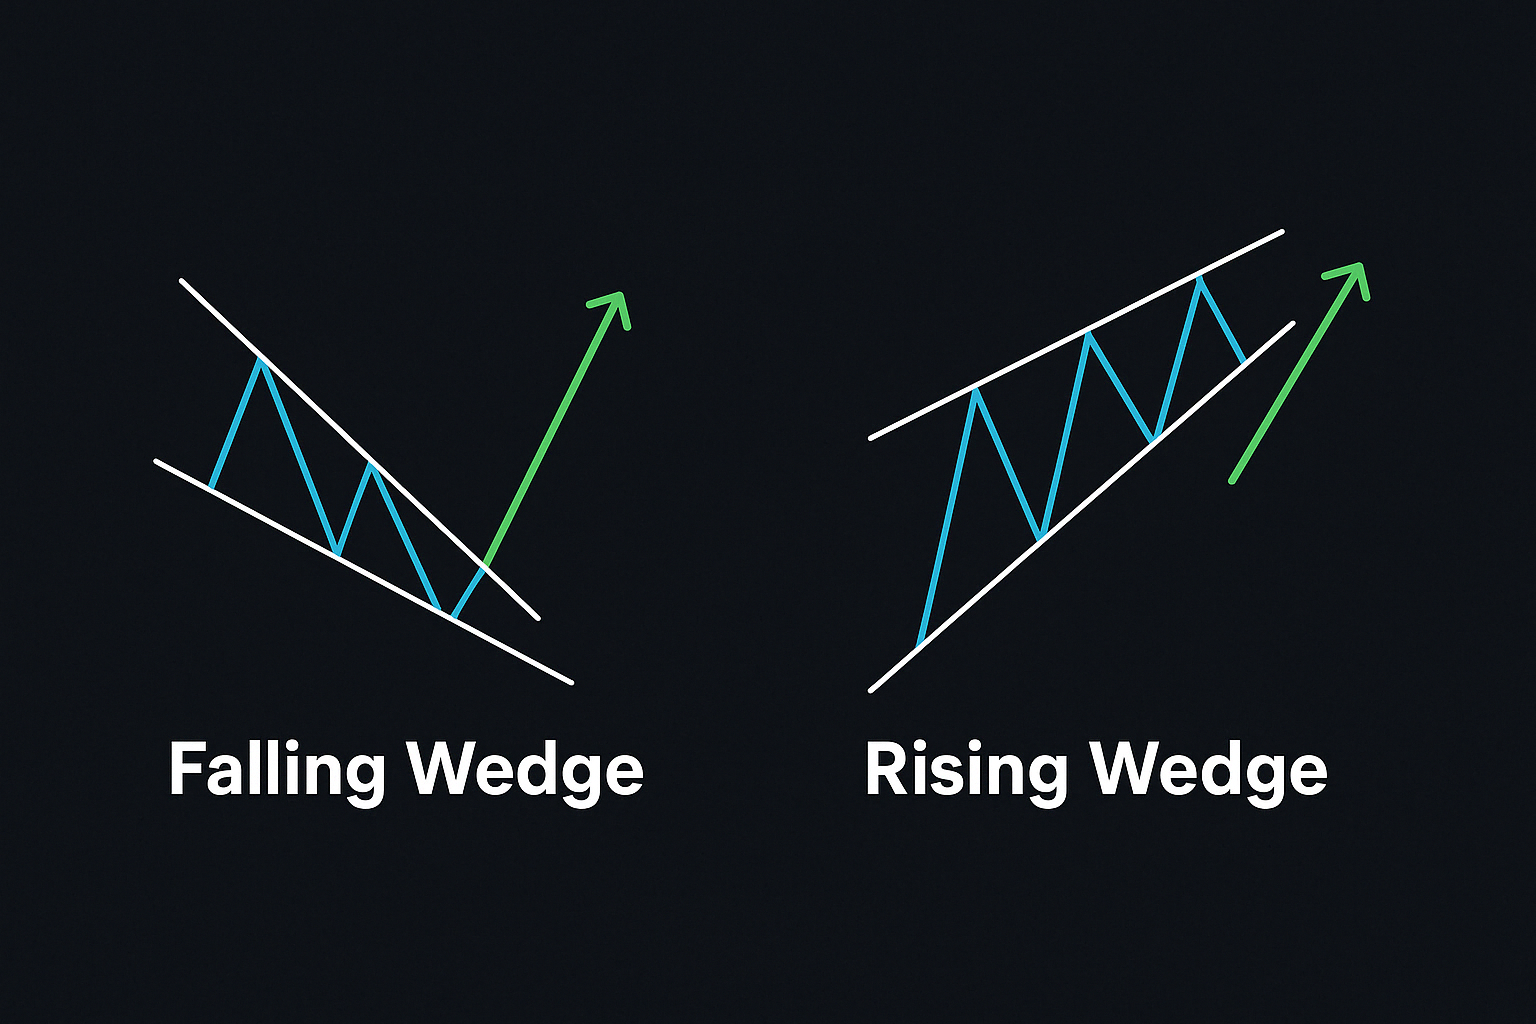
Rising Wedge
A Rising Wedge is characterized by higher highs and higher lows with converging trendlines, where the upper trendline has a steeper slope than the lower trendline. This pattern can be either:
- A bearish reversal pattern when it forms during an uptrend
- A bearish continuation pattern when it forms during a downtrend
The pattern is confirmed when price breaks below the lower trendline, signaling a potential downward move. This breakdown indicates that buying pressure is diminishing, and sellers are taking control.
As with falling wedges, traders often look for divergence on oscillator indicators, where the price makes higher highs but the indicator shows lower highs, suggesting weakening upside momentum.
Trading Chart Patterns Effectively
While chart patterns provide valuable signals, their effectiveness can be enhanced by considering the following factors:
Pattern Validity
Not all patterns follow textbook formations. Consider these factors when evaluating pattern validity:
- Clearer patterns with well-defined boundaries tend to be more reliable
- Patterns that form over longer periods generally have more significance
- Volume should ideally confirm the pattern (increasing on breakouts, decreasing during consolidation)
Market Context
Always consider the broader market context when trading chart patterns:
- Patterns that align with the higher timeframe trend are typically more reliable
- Patterns at key support/resistance levels or supply/demand zones have greater significance
- Consider the overall market sentiment and fundamental factors that might influence the pattern's outcome
Entry Strategies
There are typically two approaches to entering trades based on chart patterns:
- Enter on the initial breakout from the pattern
- Wait for a retest of the broken level before entering
The first approach potentially captures more of the move but has a higher risk of false breakouts. The second approach offers better risk-reward but risks missing the move if no retest occurs.
Stop-Loss Placement
Effective stop-loss placement is crucial when trading chart patterns:
- For reversal patterns, place stops beyond the last significant point in the pattern
- For continuation patterns, place stops beyond the consolidation area
- Consider volatility when determining exact stop distance to avoid premature stop-outs
Key Takeaways
- Chart patterns form over multiple periods and represent market psychology
- Reversal patterns signal potential trend changes, while continuation patterns suggest trend resumption after consolidation
- Key reversal patterns include Head and Shoulders, Double Tops/Bottoms, and Cup and Handle
- Common continuation patterns include Triangles, Flags, and Pennants
- Wedges can signal either continuation or reversal depending on context and formation
- Pattern validity is enhanced by clear boundaries, appropriate volume, and alignment with higher timeframe trends
- Always consider the broader market context when trading based on chart patterns
Next Steps
In our next lesson, we'll explore Fibonacci trading – a powerful analytical approach that helps identify potential support, resistance, and price targets based on mathematical relationships found throughout nature and financial markets.