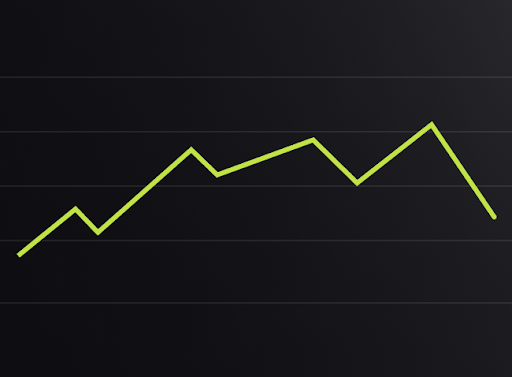
Understanding Trends
A trend occurs when price moves consistently in one direction over time. Technically speaking, an uptrend is characterized by a series of higher highs and higher lows, while a downtrend shows lower lows and lower highs.
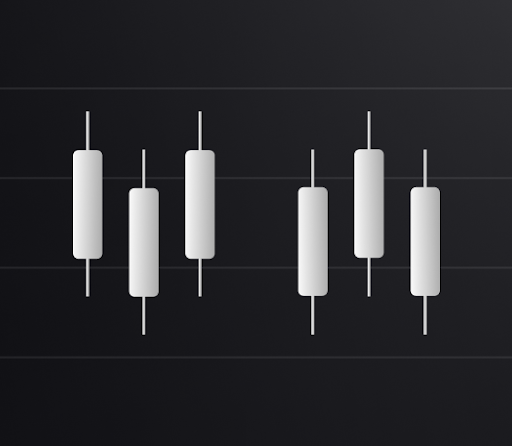
Anatomy of a Trend
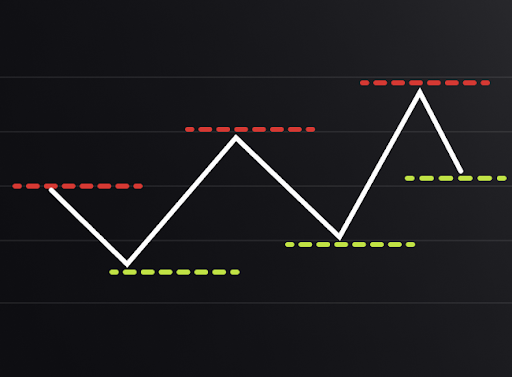
Trends are formed by swing highs and swing lows – key turning points in price action. A swing low forms when a candlestick makes a low that's lower than the candles immediately before and after it. Similarly, a swing high forms when a candlestick makes a high that's higher than the candles on either side.
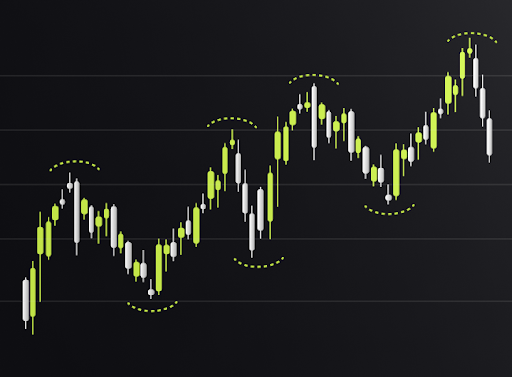
In an uptrend, each swing low is higher than the previous swing low, and each swing high is higher than the previous swing high. This creates a stair-step pattern as the market climbs. For example, in a stock like Amazon during a bull market, you might see the price pull back after a rally, form a higher low, and then continue upward to create a new higher high.
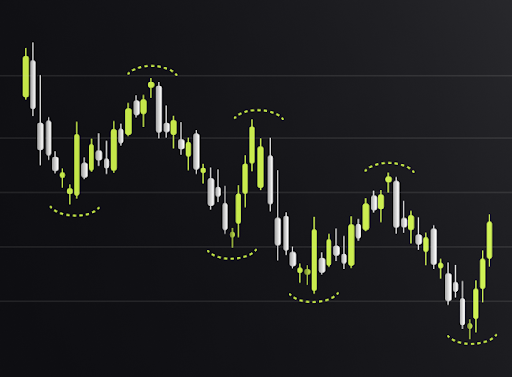
Conversely, in a downtrend, each swing high is lower than the previous swing high, and each swing low is lower than the previous swing low. This creates a descending stair-step pattern as the market falls:
Trend Changes
Identifying potential trend changes early can help you protect profits and avoid losses. A significant sign that an uptrend may be weakening occurs when price breaks below the most recent swing low that led to the highest high. This violation of the trend structure suggests that buyers no longer have full control.
Similarly, in a downtrend, when price breaks above the most recent swing high that led to the lowest low, it indicates that sellers may be losing their grip on the market.
It's important to note that markets rarely move in perfectly clean trends. False breakouts and temporary violations of swing points are common, which makes trend analysis both an art and a science. For instance, during the COVID-19 market recovery in 2020, many stocks showed multiple violations of swing lows that appeared to break their uptrends, only to resume their upward trajectory shortly after.
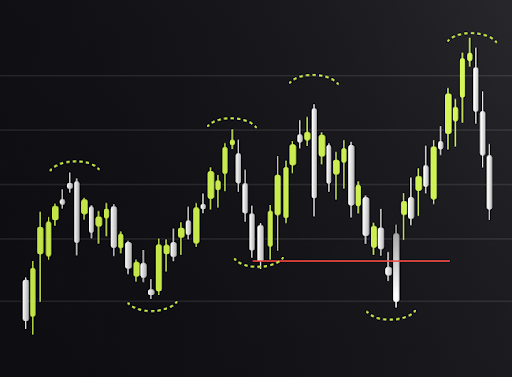
Understanding Ranges
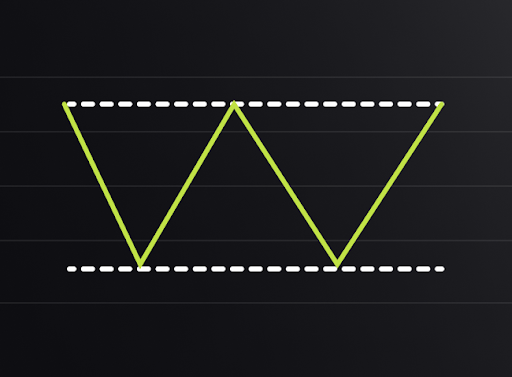
Range-bound markets occur when price oscillates between defined support and resistance levels, moving sideways rather than showing a clear directional trend. These markets are also called sideways or bracketing markets.
Anatomy of a Range
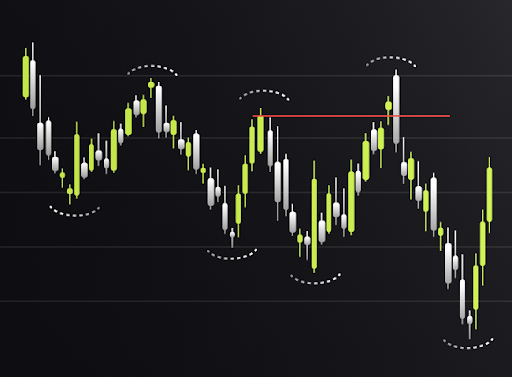
In a ranging market, price repeatedly bounces between resistance (upper boundary) and support (lower boundary). These boundaries act as price ceilings and floors where buying and selling pressure consistently emerge.
For instance, Bitcoin spent several months in 2018-2019 trading in a range between approximately $3,500 and $4,000 before eventually breaking out. During this period, traders who recognized the range could buy near support and sell near resistance, capturing the oscillations within the defined boundaries.
Key Takeaways
- Trends are characterized by higher highs and higher lows (uptrend) or lower lows and lower highs (downtrend)
- Ranges are defined by price oscillating between horizontal support and resistance levels
- Trend changes often occur when the most recent significant swing point is broken
Next Steps
Having mastered the fundamentals of trends and ranges, our next lesson will focus on support and resistance – the critical price levels that influence market turning points. Understanding these concepts will enhance your ability to identify high-probability entry and exit points in both trending and ranging markets.