What is a Japanese Candlestick?
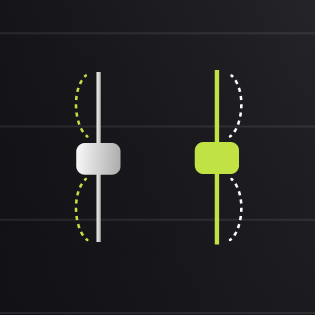
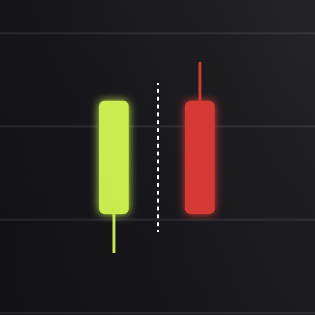
The best way to explain is by using a picture:
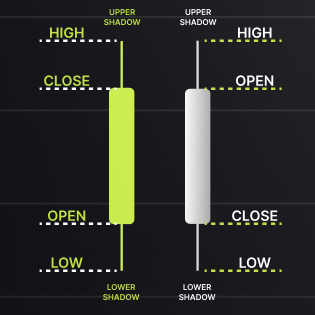
Unlike simple line charts that only show closing prices, candlesticks display four crucial price points (open, high, low, and close) for any given time period. This comprehensive view allows traders to identify patterns that signal potential market reversals, continuations, or periods of indecision.
Japanese Candlestick Anatomy
Each candlestick represents four key price points during a specific time period:
- Open: The price at the beginning of the period
- High: The highest price reached during the period
- Low: The lowest price reached during the period
- Close: The price at the end of the period
A candlestick consists of two main parts:
- The Real Body: The rectangular part of the candlestick that represents the range between the opening and closing prices
- The Shadows: The thin lines extending above and below the real body, showing the highest and lowest prices reached during the period
The color and filling of the real body indicate whether the price moved up or down:
- Bullish Candle: Usually white or green, indicating the closing price was higher than the opening price
- Bearish Candle: Usually black or red, indicating the closing price was lower than the opening price
What Candlesticks Tell Us About Market Psychology
The shape and color of a candlestick reveal valuable information about market sentiment:
Long body
Indication: Strong conviction in the direction of the move
Short body
Indication: Indecision or limited momentum
Long upper shadow
Indication: Buyers pushed prices up but couldn't sustain the move
Long lower shadow

Indication: Sellers pushed prices down but couldn't sustain the move
Equal shadows
Indication: A balance between buying and selling pressure
Basic Japanese Candlestick Patterns
The power of candlesticks comes from their ability to reveal market psychology through various patterns. Let's examine some fundamental patterns:
1. Single Candlestick Patterns
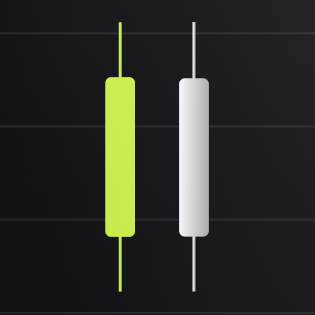
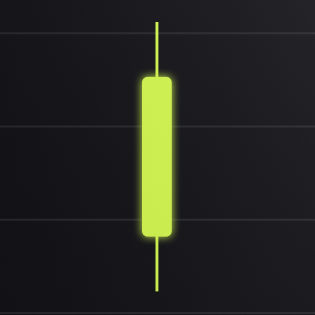
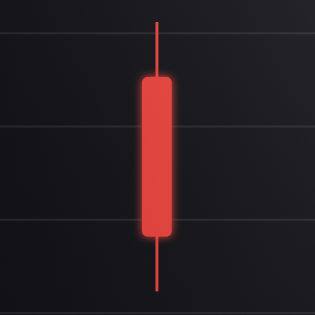
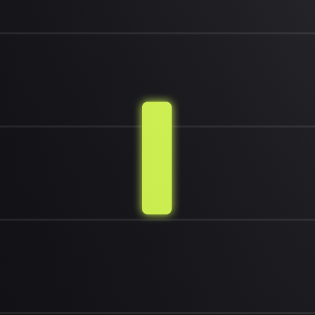
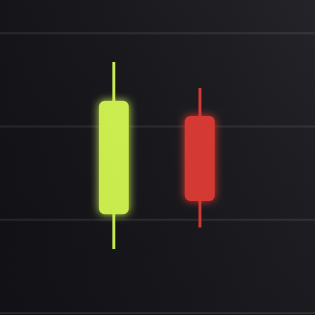
Long Day Candlesticks
Long Day Bullish: A candlestick with a long green/white body and short shadows. This shows strong buying pressure throughout the period, often signaling the potential continuation or start of an uptrend.
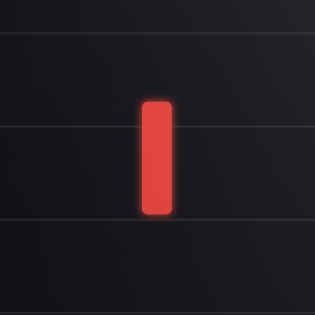
Long Day Bearish: A candlestick with a long red/black body and short shadows. This shows strong selling pressure throughout the period, often signaling the potential continuation or start of a downtrend.
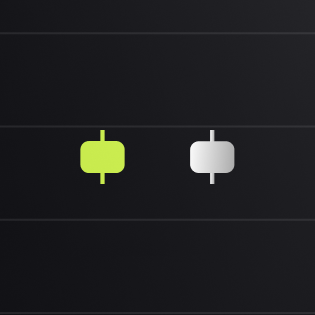
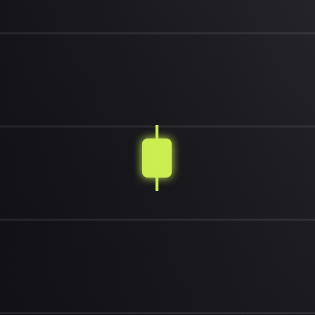
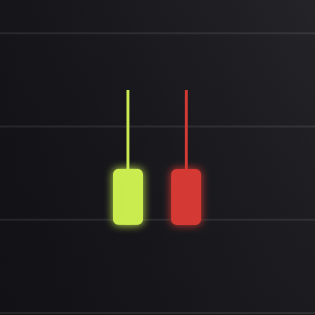
Short Day Candlesticks
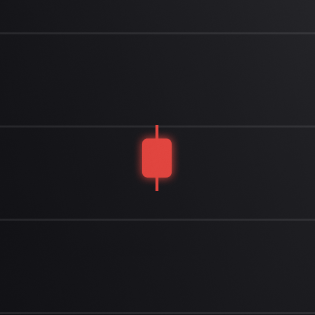
Short Day Bullish: A candlestick with a small green/white body. This indicates limited price movement during the period, suggesting low volatility or consolidation.
Short Day Bearish: A candlestick with a small red/black body. This also indicates limited price movement, often preceding a volatility expansion.
Marubozu Candlesticks
"Marubozu" means "bald head" or "shaved head" in Japanese, referring to the absence of shadows.
Bullish Marubozu: A candlestick with a long green/white body and no shadows. This shows buyers controlled the entire trading session, with prices opening at the low and closing at the high.
Bearish Marubozu: A candlestick with a long red/black body and no shadows. This shows sellers controlled the entire trading session, with prices opening at the high and closing at the low.
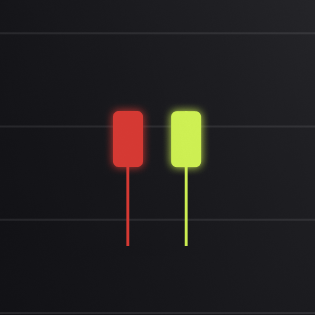
Opening Marubozu (bullish or bearish): Candlesticks with a shadow only at the closing end.
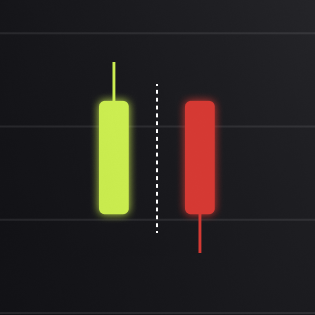
Closing Marubozu (bullish or bearish): Candlesticks with a shadow only at the opening end.
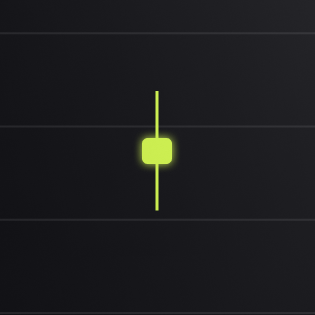
Doji Candlesticks
The word "doji" means "same time" or "simultaneous" in Japanese, referring to the equality of opening and closing prices. A Doji forms when the opening and closing prices are virtually identical, creating a candlestick with a very small body or no body at all. This pattern indicates indecision in the market, with neither buyers nor sellers gaining control.
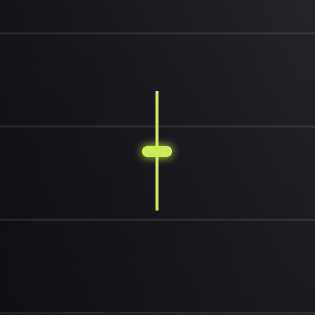
Types of Doji:
Standard Doji: Has approximately equal upper and lower shadows, suggesting perfect equilibrium between buyers and sellers. Standard Doji was depicted on the previous image.
Long-legged Doji: Has long upper and lower shadows, indicating extreme volatility and significant indecision.
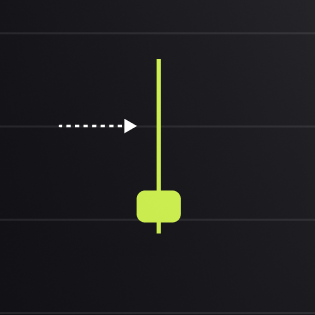
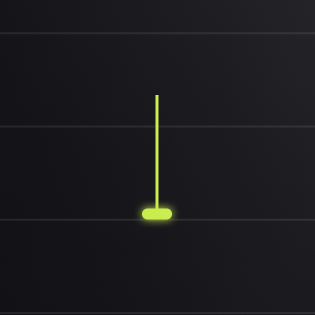
Dragonfly Doji: Has no upper shadow and a long lower shadow. When appearing at the bottom of a downtrend, it often signals a potential bullish reversal, as it shows sellers pushed prices down, but buyers regained control by the close.
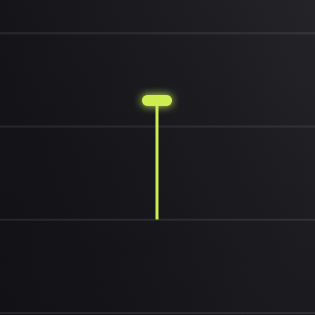
Gravestone Doji: Has no lower shadow and a long upper shadow. When appearing at the top of an uptrend, it often signals a potential bearish reversal, as it shows buyers pushed prices up, but sellers regained control by the close.
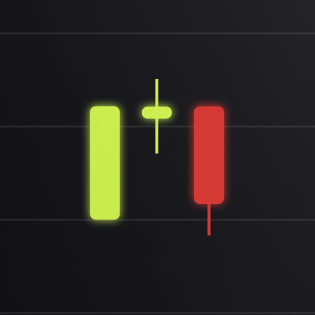
Spinning Top
A Spinning Top has a small real body with relatively long upper and lower shadows. Similar to the Doji, it indicates indecision but with a slight directional bias shown by the small body color. The small body in relation to the shadows suggests that neither buyers nor sellers gained significant ground, though one side closed with a marginal advantage.
These candlesticks show significant price movement during the session (as indicated by the long shadows) but little net change from open to close (as shown by the small body). This pattern reveals substantial intraday volatility without a decisive outcome, often indicating that the market is reassessing the current price level or trend.
2. Dual Candlestick Patterns
Engulfing Patterns
Engulfing patterns are among the most reliable candlestick signals, particularly when accompanied by higher-than-average volume on the engulfing candle. The more significant the size difference between the two candles, the stronger the reversal signal.
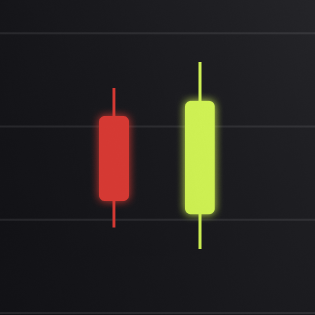
Bullish Engulfing
A two-candle pattern where a small bearish candle is followed by a larger bullish candle that completely "engulfs" the previous candle's body. This pattern suggests a potential bullish reversal when found at the bottom of a downtrend.
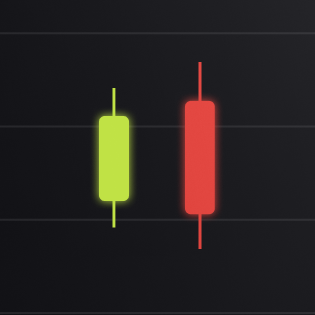
Bearish Engulfing
A two-candle pattern where a small bullish candle is followed by a larger bearish candle that completely engulfs the previous candle's body. This pattern suggests a potential bearish reversal when found at the top of an uptrend.
Harami Patterns
The word "harami" means "pregnant" in Japanese, referring to how the smaller second candle is contained within the larger first candle, resembling a pregnant woman. This visual metaphor makes the pattern easy to recognize and remember. Harami patterns signal a potential slowdown or reversal of the current trend.
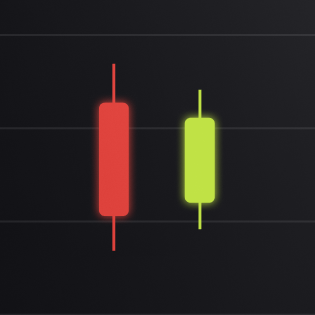
Bullish Harami
A two-candle pattern where a large bearish candle is followed by a smaller bullish candle completely contained within the previous candle's body. This pattern suggests a potential bullish reversal when found at the bottom of a downtrend.
Bearish Harami
A two-candle pattern where a large bullish candle is followed by a smaller bearish candle completely contained within the previous candle's body. This pattern suggests a potential bearish reversal when found at the top of an uptrend.
Tweezer Tops and Bottoms
Tweezer patterns are characterized by two candlesticks that have identical highs (for tops) or identical lows (for bottoms). These patterns indicate precise price rejection at specific levels, suggesting important support or resistance.
Tweezer Top:
Two candlesticks with matching highs, with the first being bullish and the second bearish. This pattern suggests a potential bearish reversal when found at the top of an uptrend.
Tweezer Bottom:
Two candlesticks with matching lows, with the first being bearish and the second bullish. This pattern suggests a potential bullish reversal when found at the bottom of a downtrend.
3. Triple Candlestick Patterns
Morning Star and Evening Star
Morning Star and Evening Star patterns are powerful three-candle reversal formations that show a complete shift in market sentiment over three periods.
Morning Star is a three-candle pattern consisting of:
- A long bearish candle showing strong selling pressure
- A small-bodied candle (often a doji or spinning top) showing indecision
- A bullish candle closing at least halfway up the first candle, showing renewed buying pressure
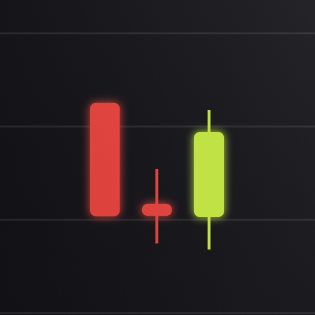
This pattern suggests a potential bullish reversal when found at the bottom of a downtrend. The name "morning star" comes from the small middle candle, which represents hope in the darkness, like the morning star in the night sky heralding the coming dawn.
Evening star is a three-candle pattern consisting of:
- A long bullish candle showing strong buying pressure
- A small-bodied candle (often a doji or spinning top) showing indecision
- A bearish candle closing at least halfway down the first candle, showing renewed selling pressure
This pattern suggests a potential bearish reversal when found at the top of an uptrend. The name "evening star" derives from the small middle candle representing the evening star that appears as daylight (the uptrend) fades into darkness.
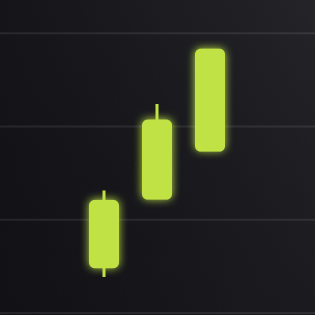
Three White Soldiers and Three Black Crows
These powerful trend continuation or reversal patterns consist of three consecutive candles showing persistent momentum in one direction.
Three White Soldiers: Three consecutive bullish candles, each opening within the previous candle's body and closing higher than the previous close. Ideally, each candle should open in the upper half of the previous candle's body and close near its high, with minimal upper shadows. This pattern shows sustained buying pressure over multiple periods and suggests strong bullish momentum.
Three Black Crows: Three consecutive bearish candles, each opening within the previous candle's body and closing lower than the previous close. Ideally, each candle should open in the lower half of the previous candle's body and close near its low, with minimal lower shadows. This pattern shows sustained selling pressure over multiple periods and suggests strong bearish momentum.
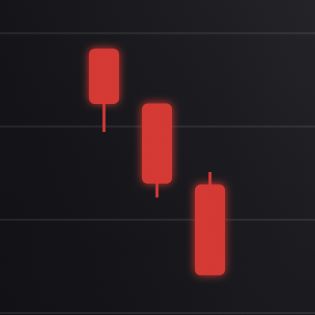
Both patterns indicate decisive control by either buyers or sellers over an extended period. When appearing against the prevailing trend, they signal potential reversals; when appearing with the trend, they confirm its continuation. The lack of significant shadows indicates little opposition to the price movement, suggesting the trend is likely to continue.
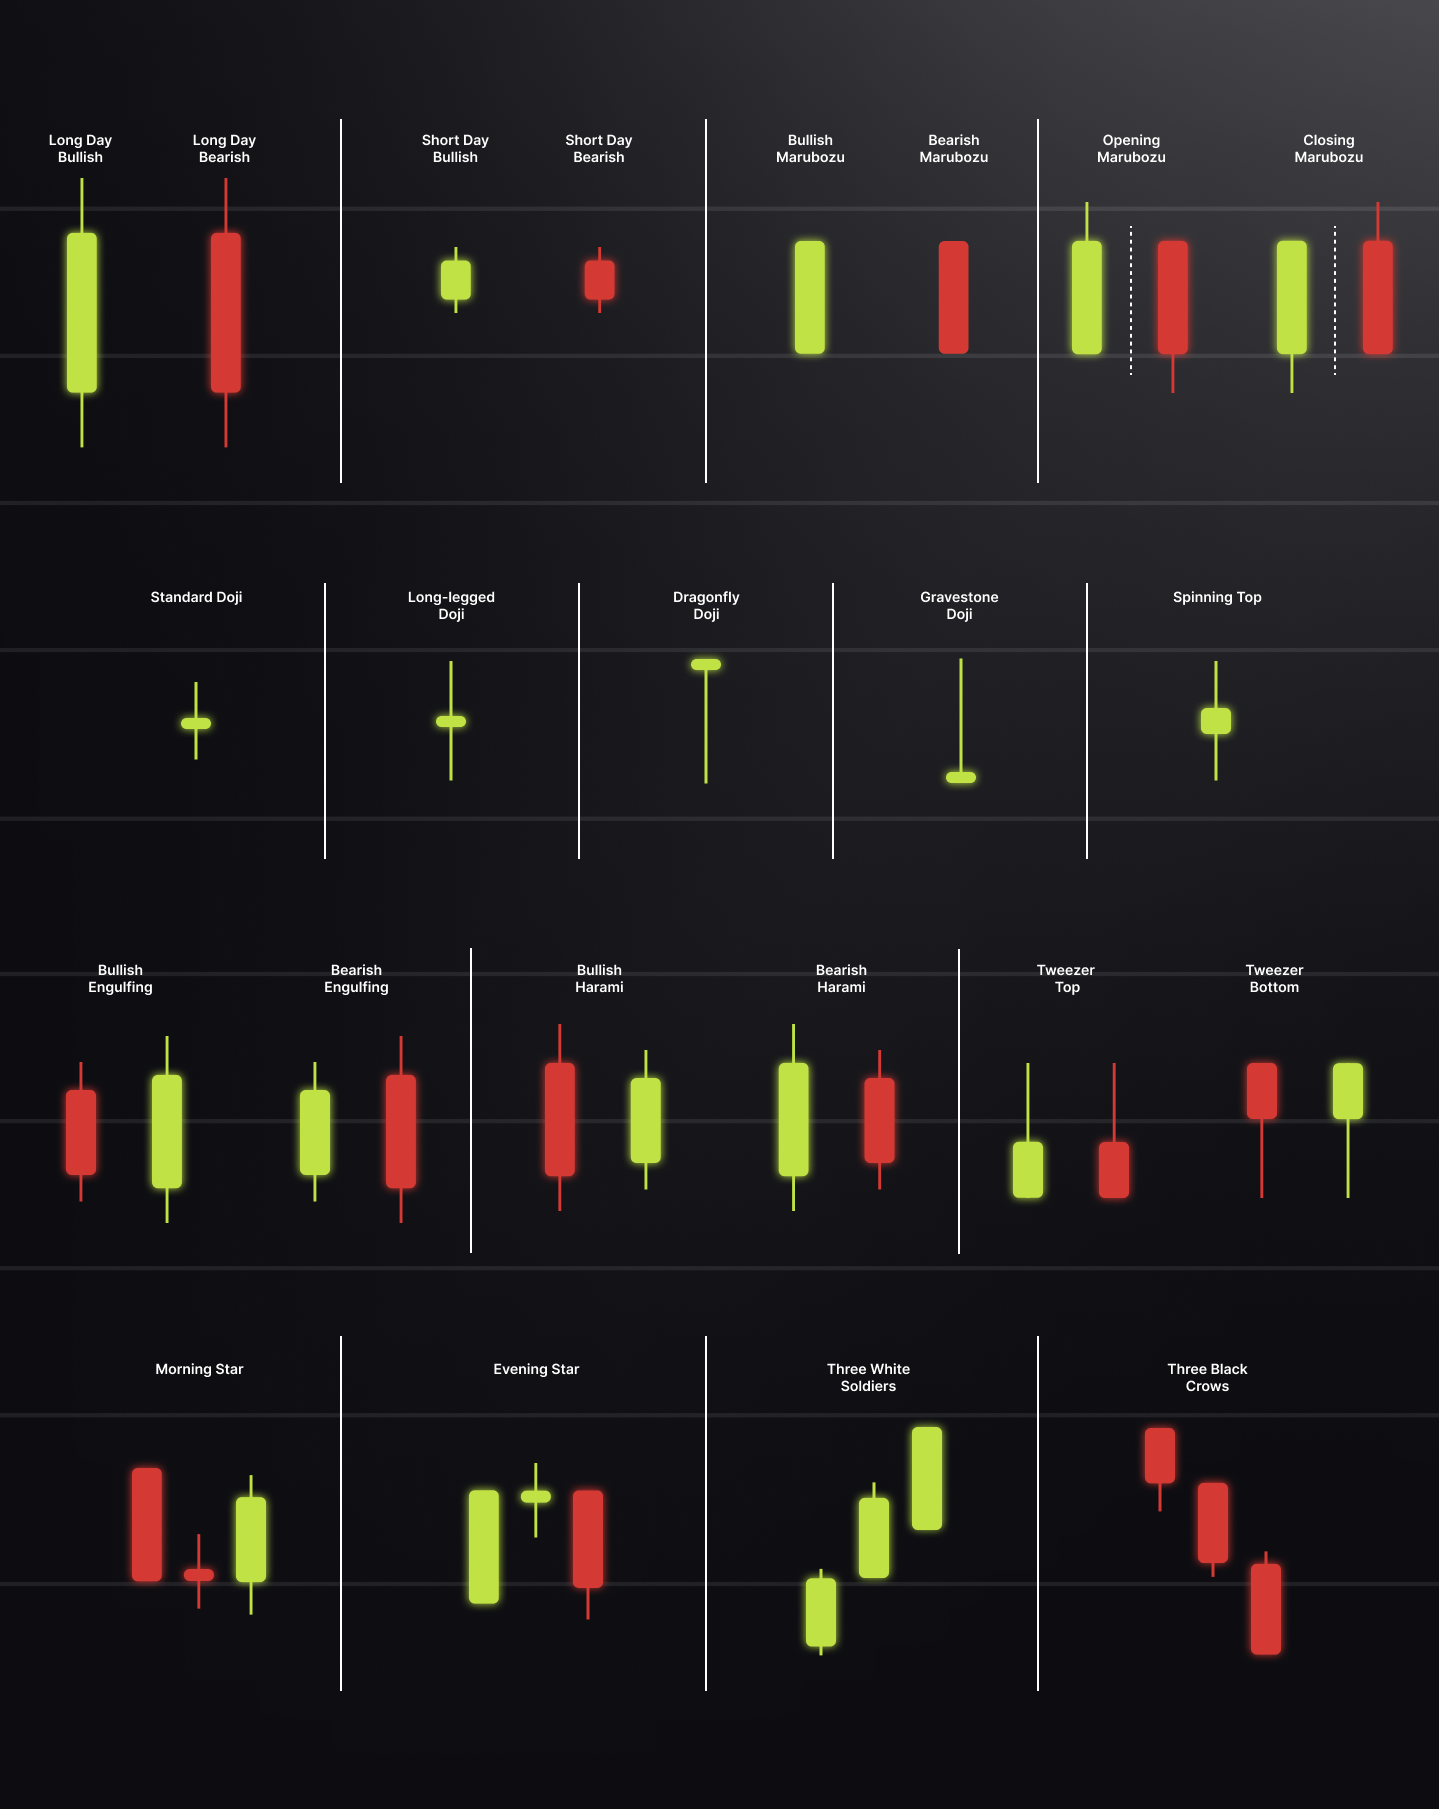
Japanese Candlestick Cheat Sheet
Understanding the various candlestick patterns takes practice, and having a quick reference guide can be extremely helpful when analyzing charts. A comprehensive cheat sheet organizes patterns by complexity and signal direction, allowing traders to quickly identify potential setups.
Practical Application: Trading with Candlesticks
Now that we understand various candlestick patterns, let's explore how to apply this knowledge in real trading situations. Successful implementation requires more than just pattern recognition—it involves integration with broader market analysis and proper risk management.
When using candlestick patterns in your trading, follow these best practices:
- Identify the overall trend first:
- Use higher timeframes to determine the primary market direction
- Align your trades with the dominant trend when possible
- Remember that candlestick signals are more reliable when they align with the larger trend
- Look for patterns at key levels:
- Support and resistance zones enhance the significance of patterns
- Previous swing highs/lows add weight to candlestick signals
- Round numbers, Fibonacci levels, and trendlines provide additional context
- Wait for confirmation:
- The candle after the pattern should confirm the expected direction
- Volume should ideally increase to validate the pattern
- Avoid entering trades based solely on pattern formation without confirmation
- Use appropriate stop-loss placement:
- For bullish patterns, place stops below the pattern's low
- For bearish patterns, place stops above the pattern's high
- Consider volatility when determining stop distance
- Combine with other technical tools:
- Use indicators like RSI, MACD, or moving averages for confirmation
- Consider broader chart patterns and market structure
- Factor in market sentiment and key fundamental developments
Implementing these practices will help you avoid false signals and maximize the effectiveness of candlestick analysis in your trading strategy.
Key takeaways
- Japanese candlesticks provide valuable insights into market psychology and price action
- Each candlestick communicates four key price points: open, high, low, and close
- Single-candle patterns like Doji, Marubozu, and Spinning Tops offer insights into market sentiment
- Multi-candle patterns like Engulfing patterns and Morning/Evening Stars offer stronger reversal signals
- Always consider the context and look for confirmation before trading on candlestick signals
- Combine candlestick analysis with other technical tools for best results
What’s next?
In the next lesson, we'll build on this foundation by exploring different types of charts, their advantages, and when to use each for your technical analysis. This will further enhance your ability to read market movements and identify profitable trading opportunities.