Statistical analysis is another tool traders use alongside technical analysis. It involves collecting, organizing, and interpreting data to identify patterns and relationships. Unlike technical analysis, which relies on indicators and chart patterns, statistical methods focus on historical price movements to develop strategies that require minimal human intervention.
In other words, statistical analysis is a structured approach to data interpretation, applying mathematical models, probability distributions, and inferential techniques to derive insights from raw information.
Advantages of Statistical Analysis:
- Objective decision-making: By relying on quantitative data, traders can reduce emotional biases, leading to more disciplined and consistent trading decisions.
- Risk assessment: Statistical measures, such as standard deviation and variance, provide insights into market volatility, helping traders evaluate and manage risk effectively.
- Strategy backtesting: Applying statistical analysis to historical data allows traders to test and refine their strategies before implementing them in live markets, enhancing the likelihood of success.
Limitations to Consider:
- Data quality: Statistical analysis's reliability depends on the data quality used. Inaccurate or manipulated data can lead to misleading conclusions.
- Changing market conditions: Markets are dynamic, and patterns identified in historical data may not persist, potentially reducing the effectiveness of strategies based solely on past data.
Descriptive Statistics: Understanding Market Data
Before making predictions, traders need to summarize past market behavior using descriptive statistics, which help make sense of large datasets. Some key metrics include:
Mean (Average): The Center of Your Data
What Is the Mean?
The mean, commonly called the average, is the sum of all values divided by the number of values.
It represents the central value of a dataset and serves as a reference point for analyzing market behavior.
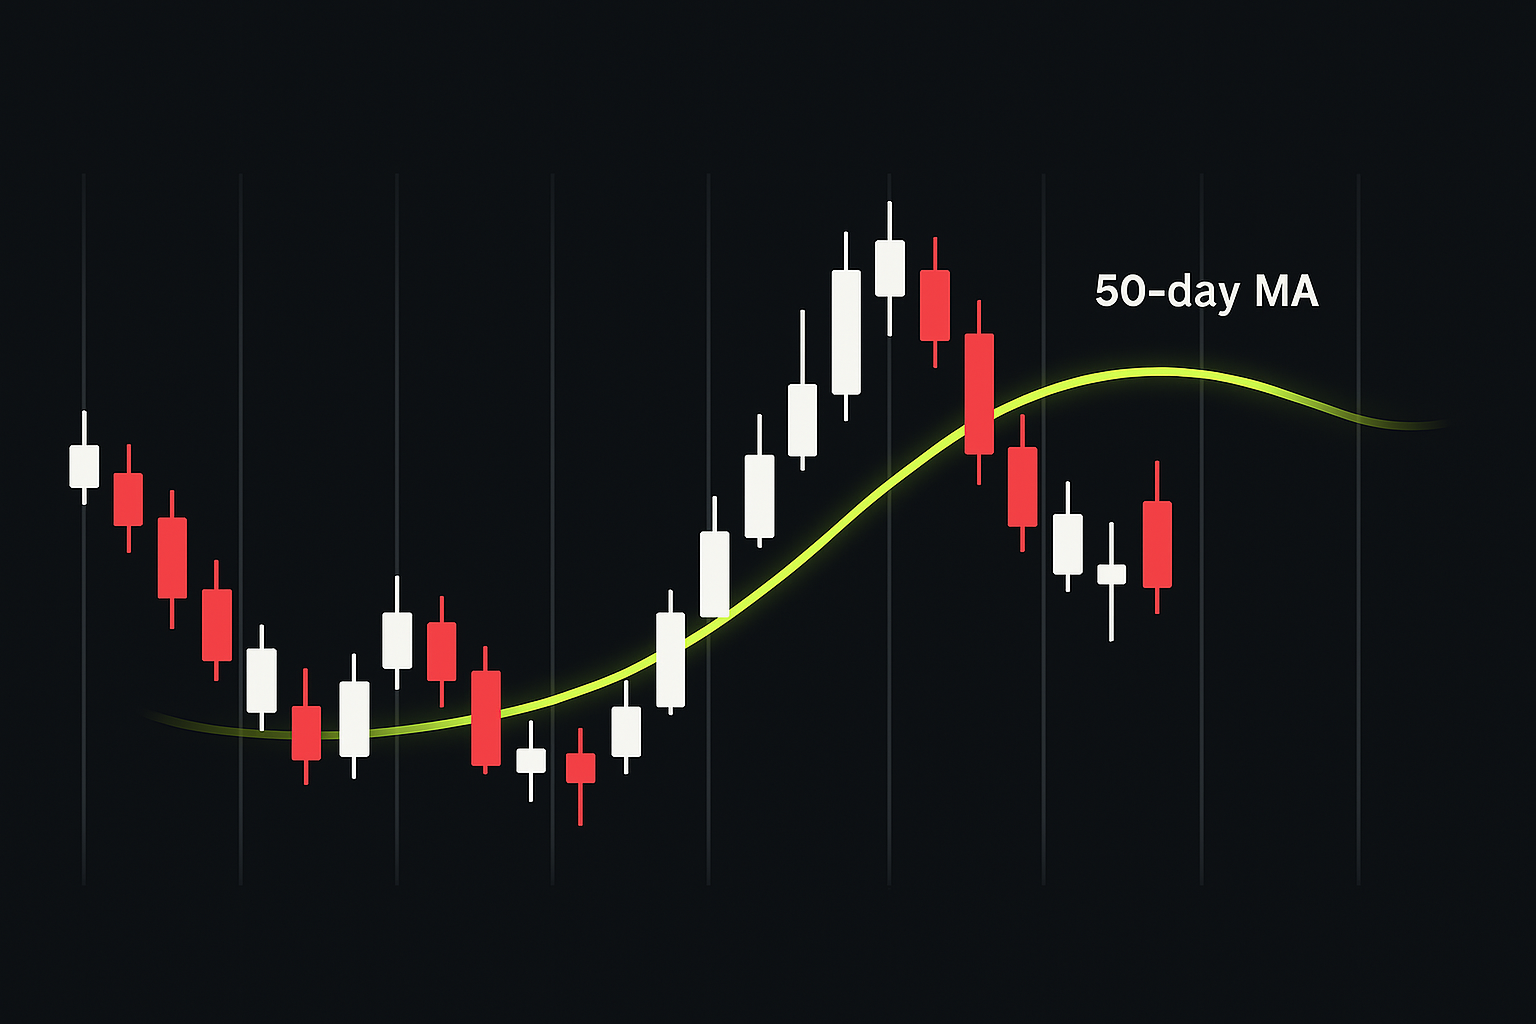
Moving averages are perhaps the most common application of means in trading.
The 200-day moving average represents the mean closing price over the past 200 trading days, updated daily by adding the newest price and removing the oldest.
Median: The Middle Value
What Is the Median?
The median is the middle value when all data points are arranged in ascending or descending order.
Unlike the mean, the median isn't affected by extreme values (outliers), making it valuable during volatile market periods.
Market Example: Daily Price Ranges
Consider these daily trading ranges (high minus low) for EUR/USD over one week:
- Monday: 45 pips
- Tuesday: 38 pips
- Wednesday: 120 pips (major economic announcement)
- Thursday: 52 pips
- Friday: 42 pips
To find the median, we arrange the values in order: 38, 42, 45, 52, 120
The median is the middle value: 45 pips.
Note that the mean would be 59.4 pips, significantly higher due to Wednesday's outlier.
The median helps traders distinguish between normal market behavior and unusual volatility.
When analyzing typical market movements, the median often provides a more reliable measure than the mean, especially after news events create temporary spikes in volatility.
Mode: The Most Common Value
What Is the Mode?
The mode is the value that appears most frequently in a dataset.
Some datasets may have multiple modes or no distinct mode.
Round-Number Support/Resistance
The mode becomes particularly useful when analyzing price levels where markets tend to reverse.
Imagine tracking the price levels where S&P 500 futures bounce during a month:
- 4305 (occurred 2 times)
- 4300 (occurred 7 times)
- 4275 (occurred 3 times)
- 4250 (occurred 4 times)
- 4225 (occurred 1 time)
The mode is 4300, suggesting this round number serves as significant support or resistance.
Traders use the mode to identify psychological price levels where orders tend to cluster.
These "round number" levels often show higher volume and can provide trading opportunities as price approaches them repeatedly.
Standard Deviation: Measuring Volatility
What Is Standard Deviation?
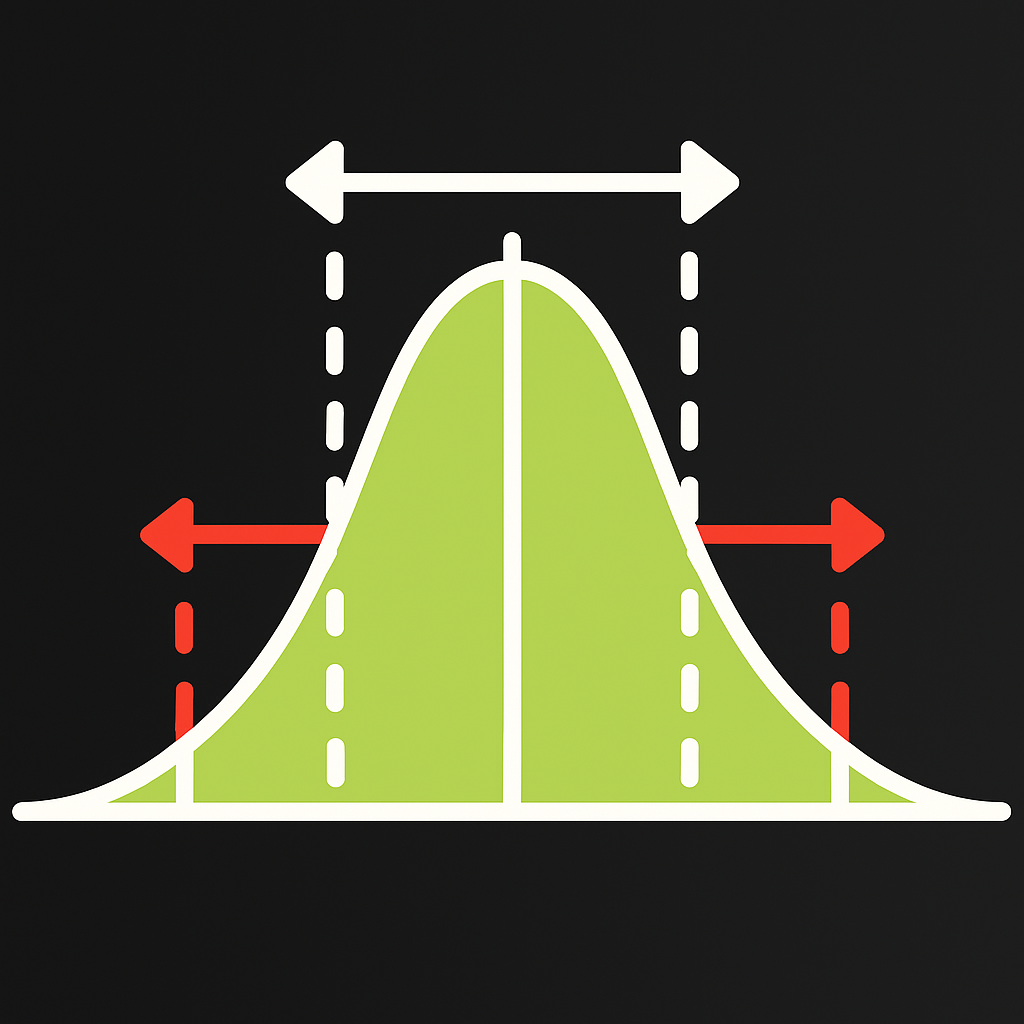
Standard deviation measures how much individual values typically differ from the mean.
A low standard deviation indicates that values tend to be close to the mean, while a high standard deviation indicates greater dispersion.
Currency Pair Volatility
Let's compare daily price ranges (in pips) for two currency pairs over a week:
EUR/USD daily ranges:
- 45, 52, 48, 55, 50
- Mean: 50 pips
- Standard deviation: 3.8 pips
GBP/JPY daily ranges:
- 85, 120, 65, 145, 95
- Mean: 102 pips
- Standard deviation: 31.3 pips
The much higher standard deviation for GBP/JPY reveals it as the more volatile pair, even though both have different average ranges.
Cheat Sheet:
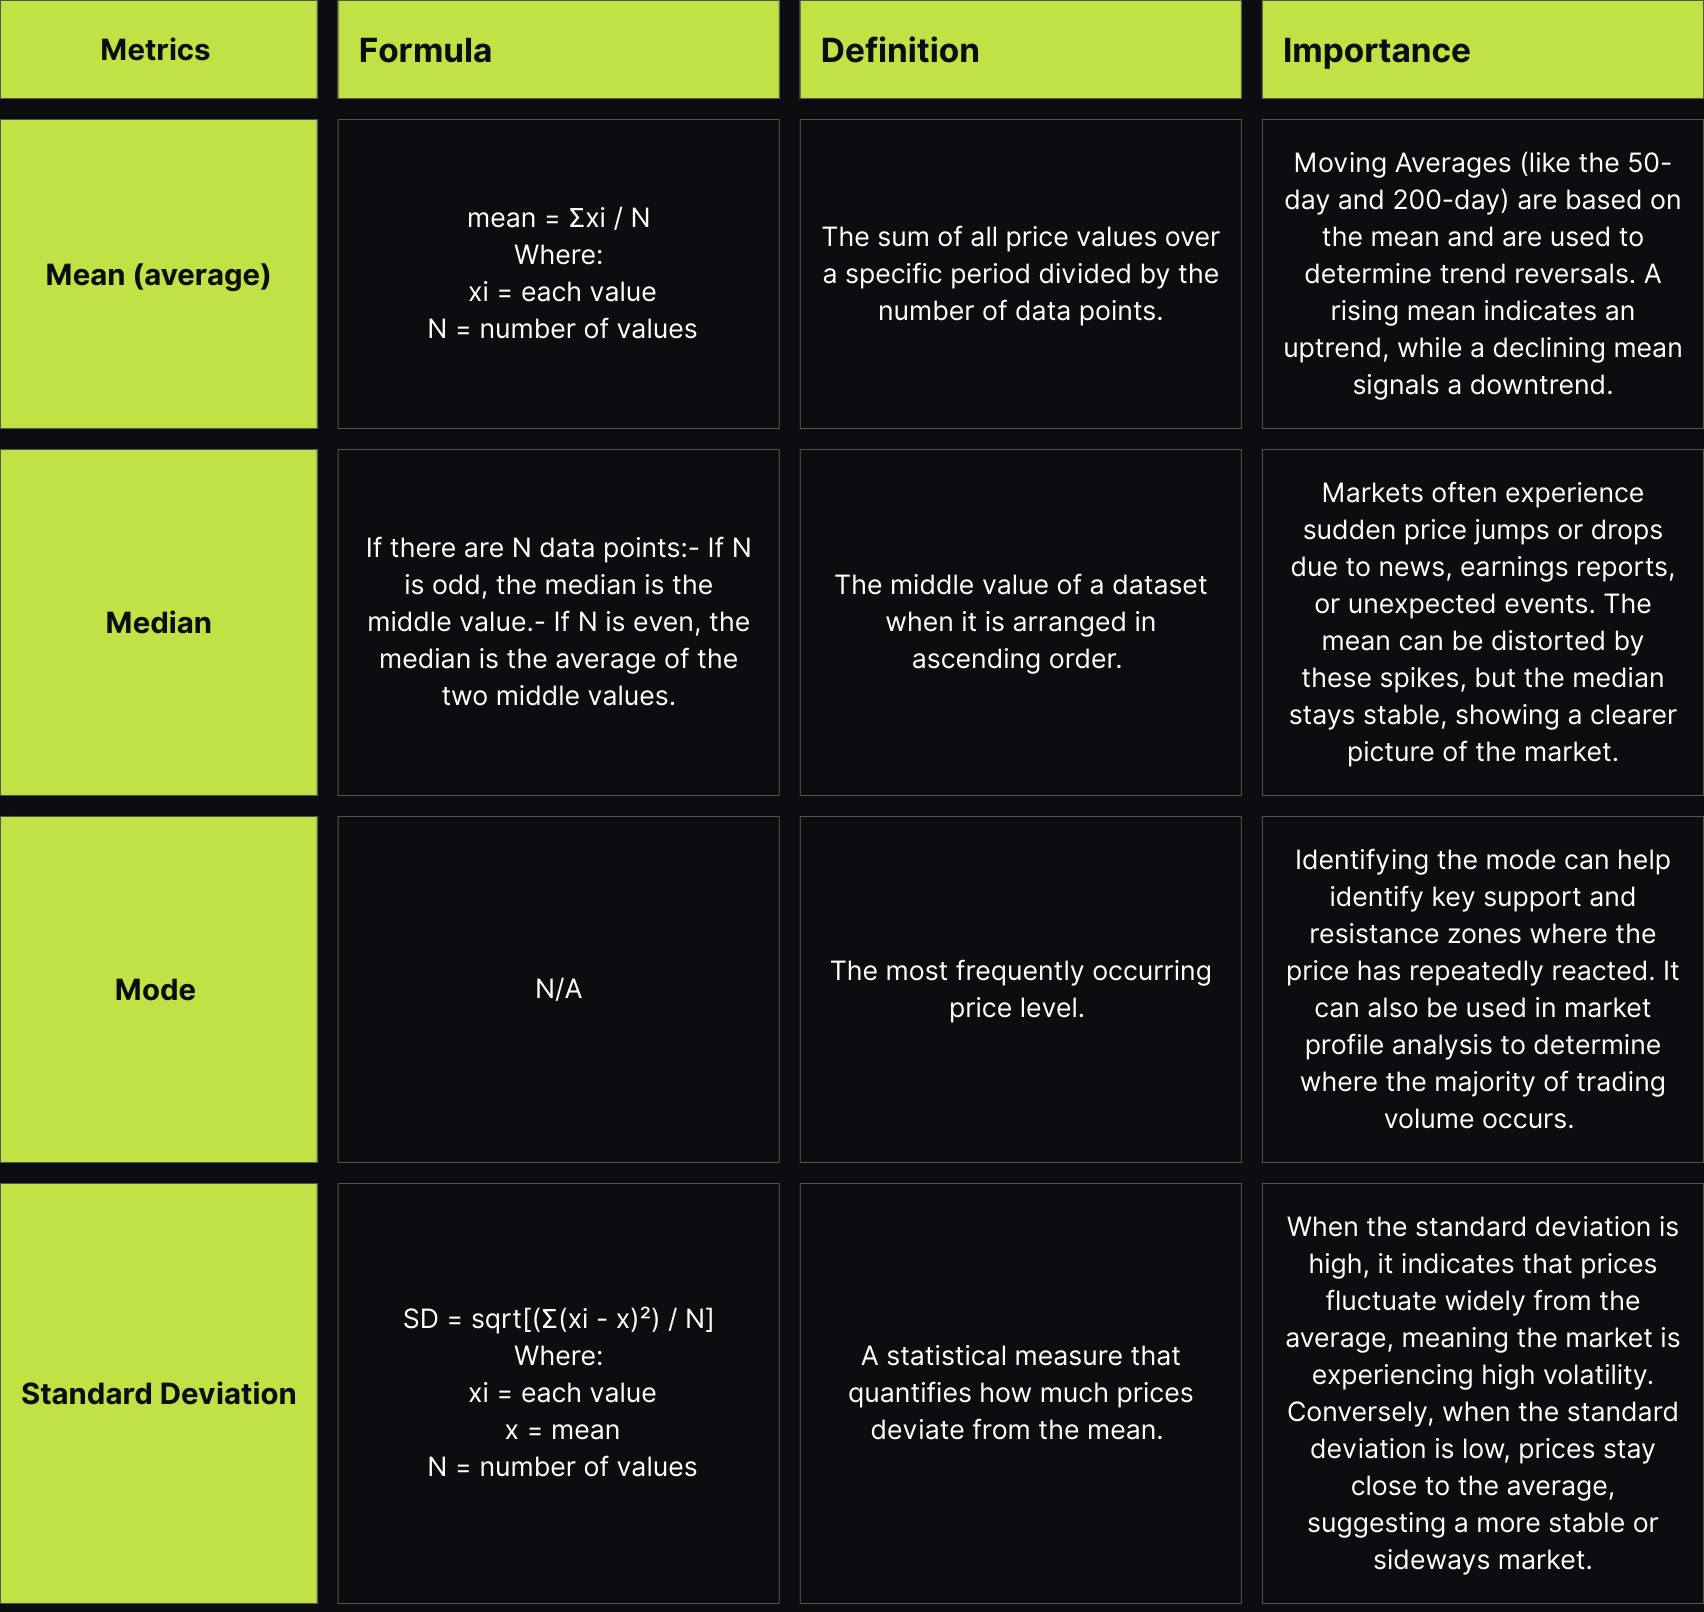
Key Takeaways
- Statistical analysis provides traders with a structured, objective approach to analyzing market data and making informed decisions.
- Its advantages include reducing emotional bias, improving risk assessment, and allowing traders to backtest strategies before applying them in live markets.
- However, statistical analysis has limitations. It depends on data accuracy, and markets evolve, meaning past trends don’t always hold.
- Descriptive statistics are essential for interpreting market trends. The mean identifies overall trends, the median reduces the impact of outliers, the mode pinpoints key price levels, and the standard deviation measures volatility.
- Traders use these statistical tools to refine their strategies, manage risk, and anticipate price movements.
Next Steps
Now that we've covered the basics of statistical analysis, we'll explore probabilities in trading, covering win rates, risk-reward ratios, and expected value. Then, we’ll focus on risk management to protect capital and backtesting to refine strategies using historical data.